Fig. 2
Download original image
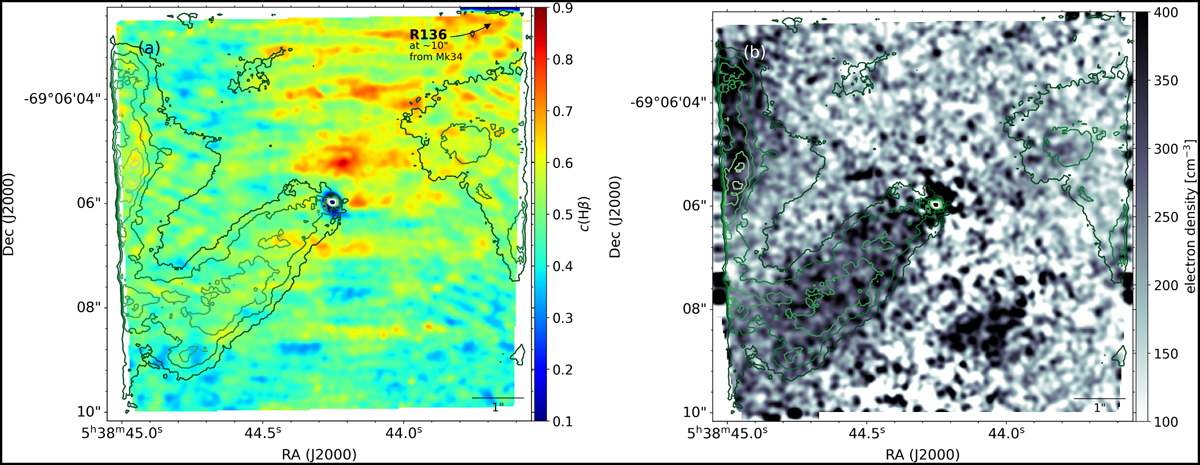
Reddening coefficient c(Hβ) (left panel) and electron density (right panel) maps. Both panels display the emission distribution of [NII] λ6583 (green contours) described in Fig. 1 as a reference and, marking the proposed direction of the main outflow in Mk 34. The distance to the center of NGC 2070, the cluster R136, is marked in panel a.
Current usage metrics show cumulative count of Article Views (full-text article views including HTML views, PDF and ePub downloads, according to the available data) and Abstracts Views on Vision4Press platform.
Data correspond to usage on the plateform after 2015. The current usage metrics is available 48-96 hours after online publication and is updated daily on week days.
Initial download of the metrics may take a while.