Fig. 1
Download original image
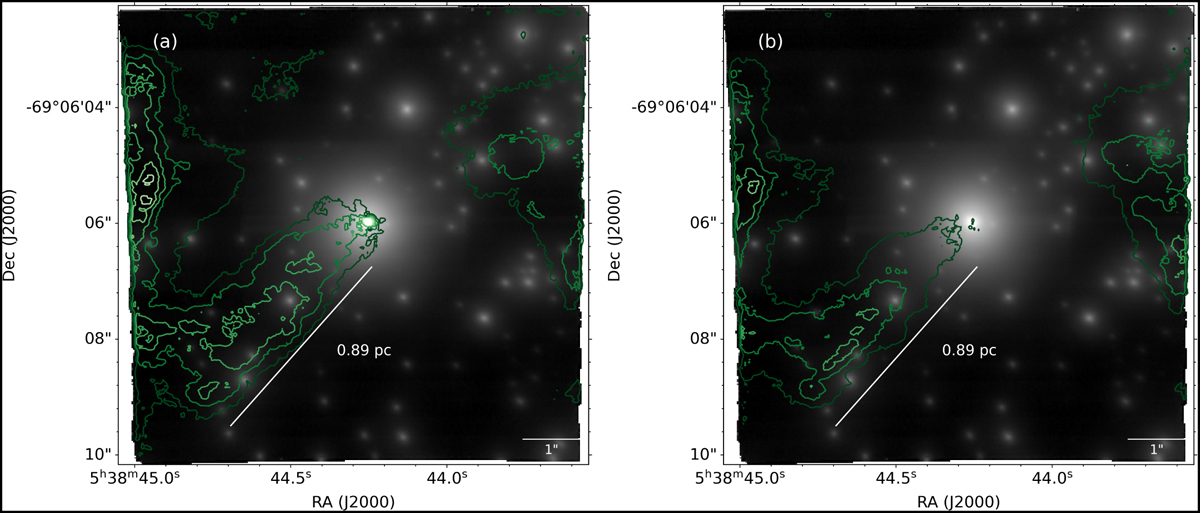
Emission line maps within the field of view of MUSE-NFM (approximately 7.5″×7.5″) around Mk 34. Panel a: [NII] λ 6583 emission line map. Panel b: [SII] λ 6717 emission line map. We use the same intensity contours in both maps: contours range from 6 × 10⁻¹⁹ to 2 × 10⁻¹⁸ in steps of 2 × 10⁻¹⁹ erg s−1 cm−2 per spaxel. The MUSE-NFM image in the Johnson V band is shown in the background of both panels.
Current usage metrics show cumulative count of Article Views (full-text article views including HTML views, PDF and ePub downloads, according to the available data) and Abstracts Views on Vision4Press platform.
Data correspond to usage on the plateform after 2015. The current usage metrics is available 48-96 hours after online publication and is updated daily on week days.
Initial download of the metrics may take a while.