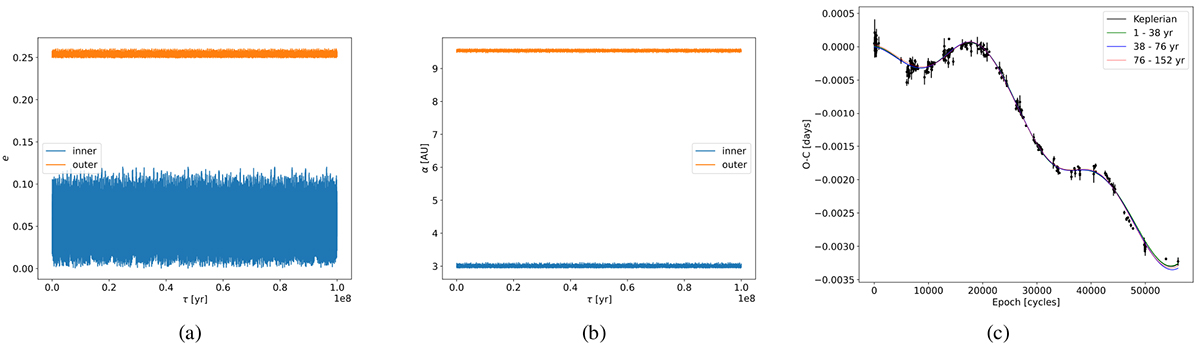
Fig. 7.
Download original image
Orbital evolution of (a) eccentricities and (b) semi-major axes for the inner and outer planets over 100 Myr (dataset B, Run 1, χν, min2). (c) The temporal variation of the χν, min2 fitting curve (dataset B, Run 1) over the first 152 years is represented by five sets of parameters, each corresponding to a complete outer orbit revolution (38 years). The black synthetic curve is the Keplerian (kinematic) fit from which this dynamical model was initialized, and it appears to be in absolute agreement with the first 38 years of orbital evolution (green curve) and in close agreement with the subsequent fits (blue and red curves).
Current usage metrics show cumulative count of Article Views (full-text article views including HTML views, PDF and ePub downloads, according to the available data) and Abstracts Views on Vision4Press platform.
Data correspond to usage on the plateform after 2015. The current usage metrics is available 48-96 hours after online publication and is updated daily on week days.
Initial download of the metrics may take a while.