Fig. 4.
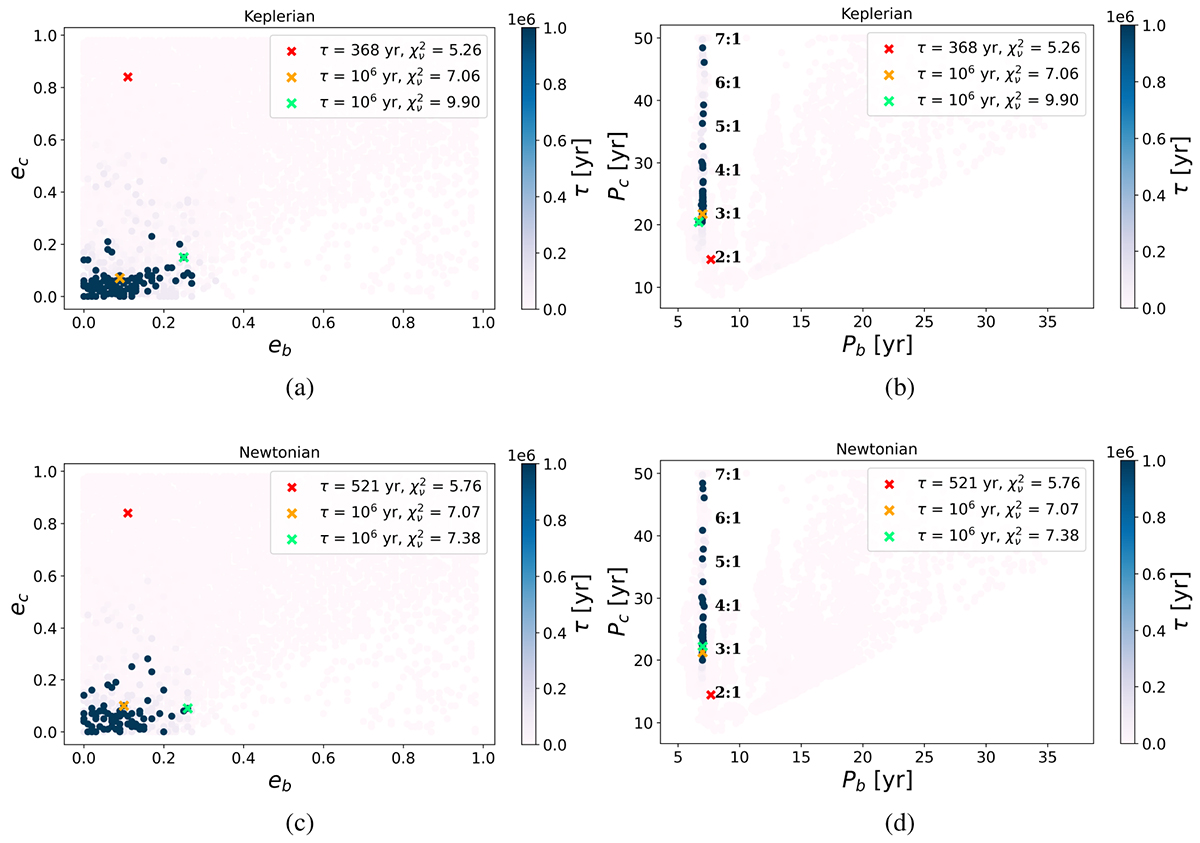
Download original image
Top: Lifetime colormap plots in the (a) eb, ec and (b) Pb, Pc planes for 5838 Keplerian models (99 stable) within the 90% confidence level of χν, best2 as they resulted from optimization Run 1 for dataset A. Bottom: Same as top but for 5838 Newtonian models (74 stable). The color coding displays the range of lifetimes from white to dark blue, while the orange and green crosses correspond to the positions of the minimum- and maximum-reduced chi-square value of the stable configurations. The best-fitting curve to the data is identified by the red cross, which is unstable in all cases. The MMR solutions have been labeled in the Pb, Pc plane for the nominal Pb = 7 yr.
Current usage metrics show cumulative count of Article Views (full-text article views including HTML views, PDF and ePub downloads, according to the available data) and Abstracts Views on Vision4Press platform.
Data correspond to usage on the plateform after 2015. The current usage metrics is available 48-96 hours after online publication and is updated daily on week days.
Initial download of the metrics may take a while.