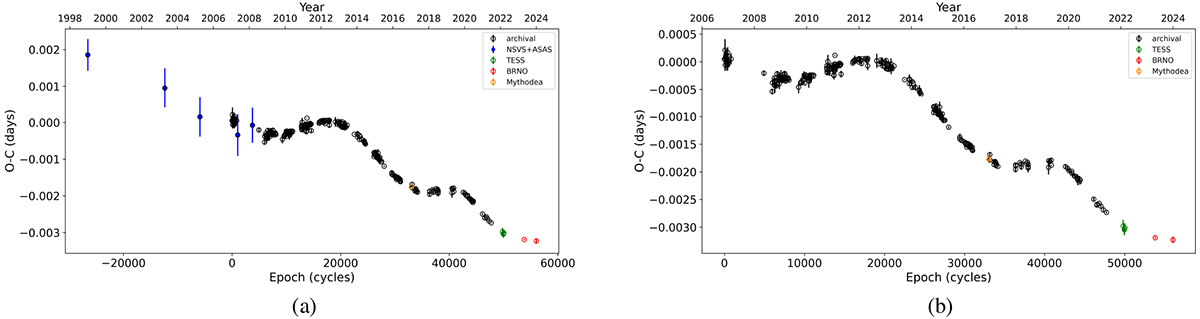
Fig. 2.
Download original image
ETV diagrams of NSVS 14256825. (a) ETV diagram of dataset A spanning 26 years (1999–2024). Archival data ∼black open circles; NSVS+ASAS data ∼blue open circles; Mythodea data ∼orange open circles; TESS data ∼green open circles; B.R.N.O. data ∼red open circles. (b) ETV diagram of dataset B spanning 18 years (2007–2024). Color indexing is the same as in (a).
Current usage metrics show cumulative count of Article Views (full-text article views including HTML views, PDF and ePub downloads, according to the available data) and Abstracts Views on Vision4Press platform.
Data correspond to usage on the plateform after 2015. The current usage metrics is available 48-96 hours after online publication and is updated daily on week days.
Initial download of the metrics may take a while.