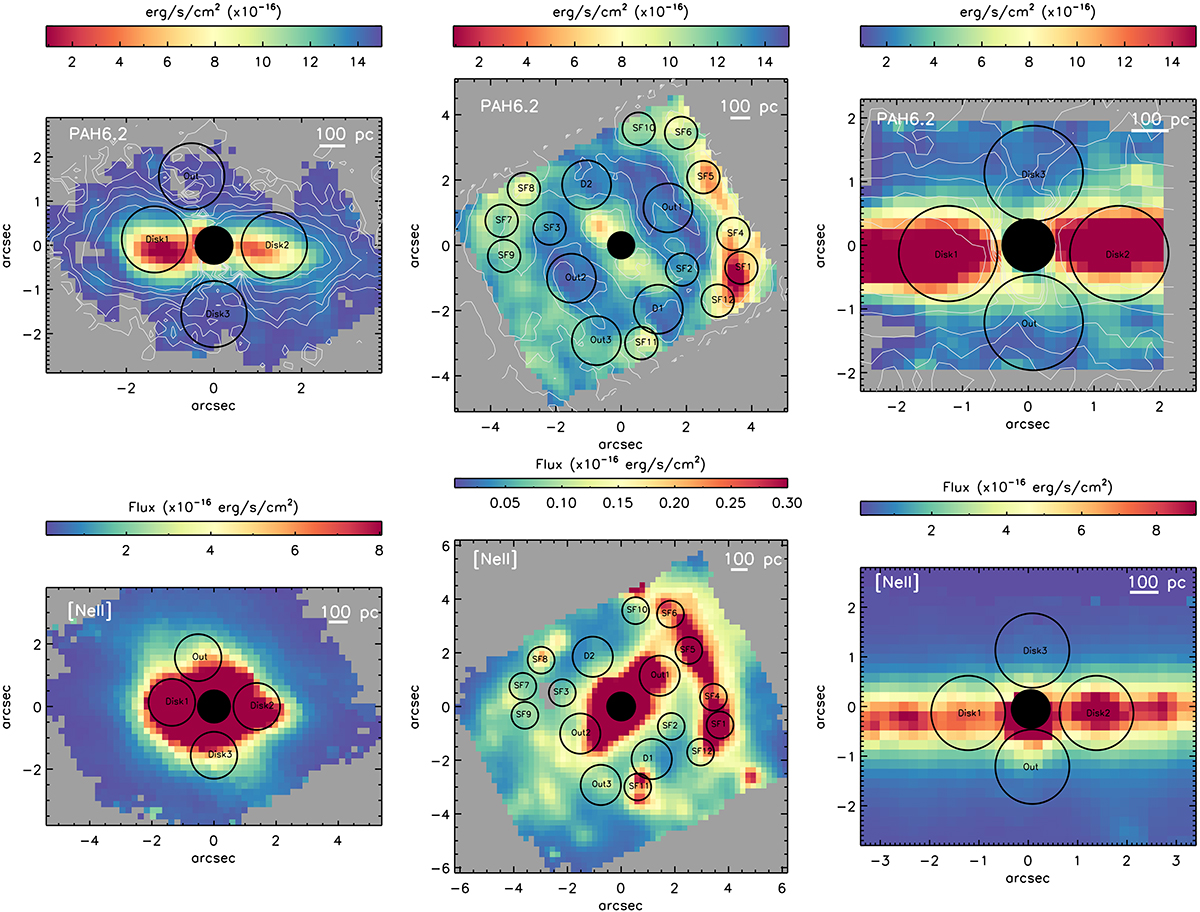
Fig. C.1.
Download original image
Maps showing the selected apertures. From left to right panels: NGC 5506, NCG 5728 and NGC 7172. Top panels: 6.2 μm PAH feature intensity map. The white contours are the 11.3 μm PAH emission on a logarithmic scale (same values as in bottom panels of Fig. 3). Bottom panels: [Ne II] 12.81 μm intensity map. North is up and east is to the left, and offsets are measured relative to the AGN. Black circles correspond with the extracted apertures.
Current usage metrics show cumulative count of Article Views (full-text article views including HTML views, PDF and ePub downloads, according to the available data) and Abstracts Views on Vision4Press platform.
Data correspond to usage on the plateform after 2015. The current usage metrics is available 48-96 hours after online publication and is updated daily on week days.
Initial download of the metrics may take a while.