Fig. 7.
Download original image
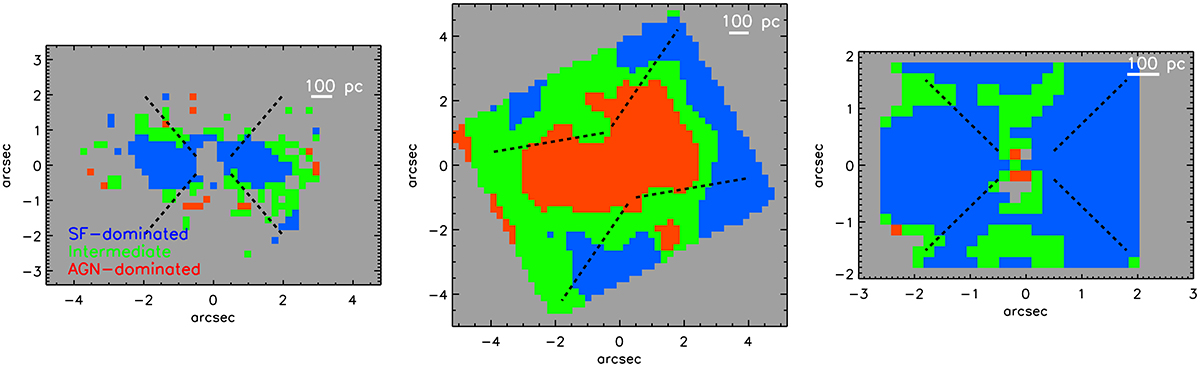
JWST/MRS 6.2 μm PAH/H2 S(1) ratio maps. From left to right: NGC 5506, NGC 5728, and NCG 7172. Maps are colour-coded following the criteria in Fig. 6. The SF-, AGN-dominated, and intermediate regions are shown in blue, red, and green, respectively. North is up and east is to the left. Offsets are measured relative to the AGN.
Current usage metrics show cumulative count of Article Views (full-text article views including HTML views, PDF and ePub downloads, according to the available data) and Abstracts Views on Vision4Press platform.
Data correspond to usage on the plateform after 2015. The current usage metrics is available 48-96 hours after online publication and is updated daily on week days.
Initial download of the metrics may take a while.