Fig. C.2.
Download original image
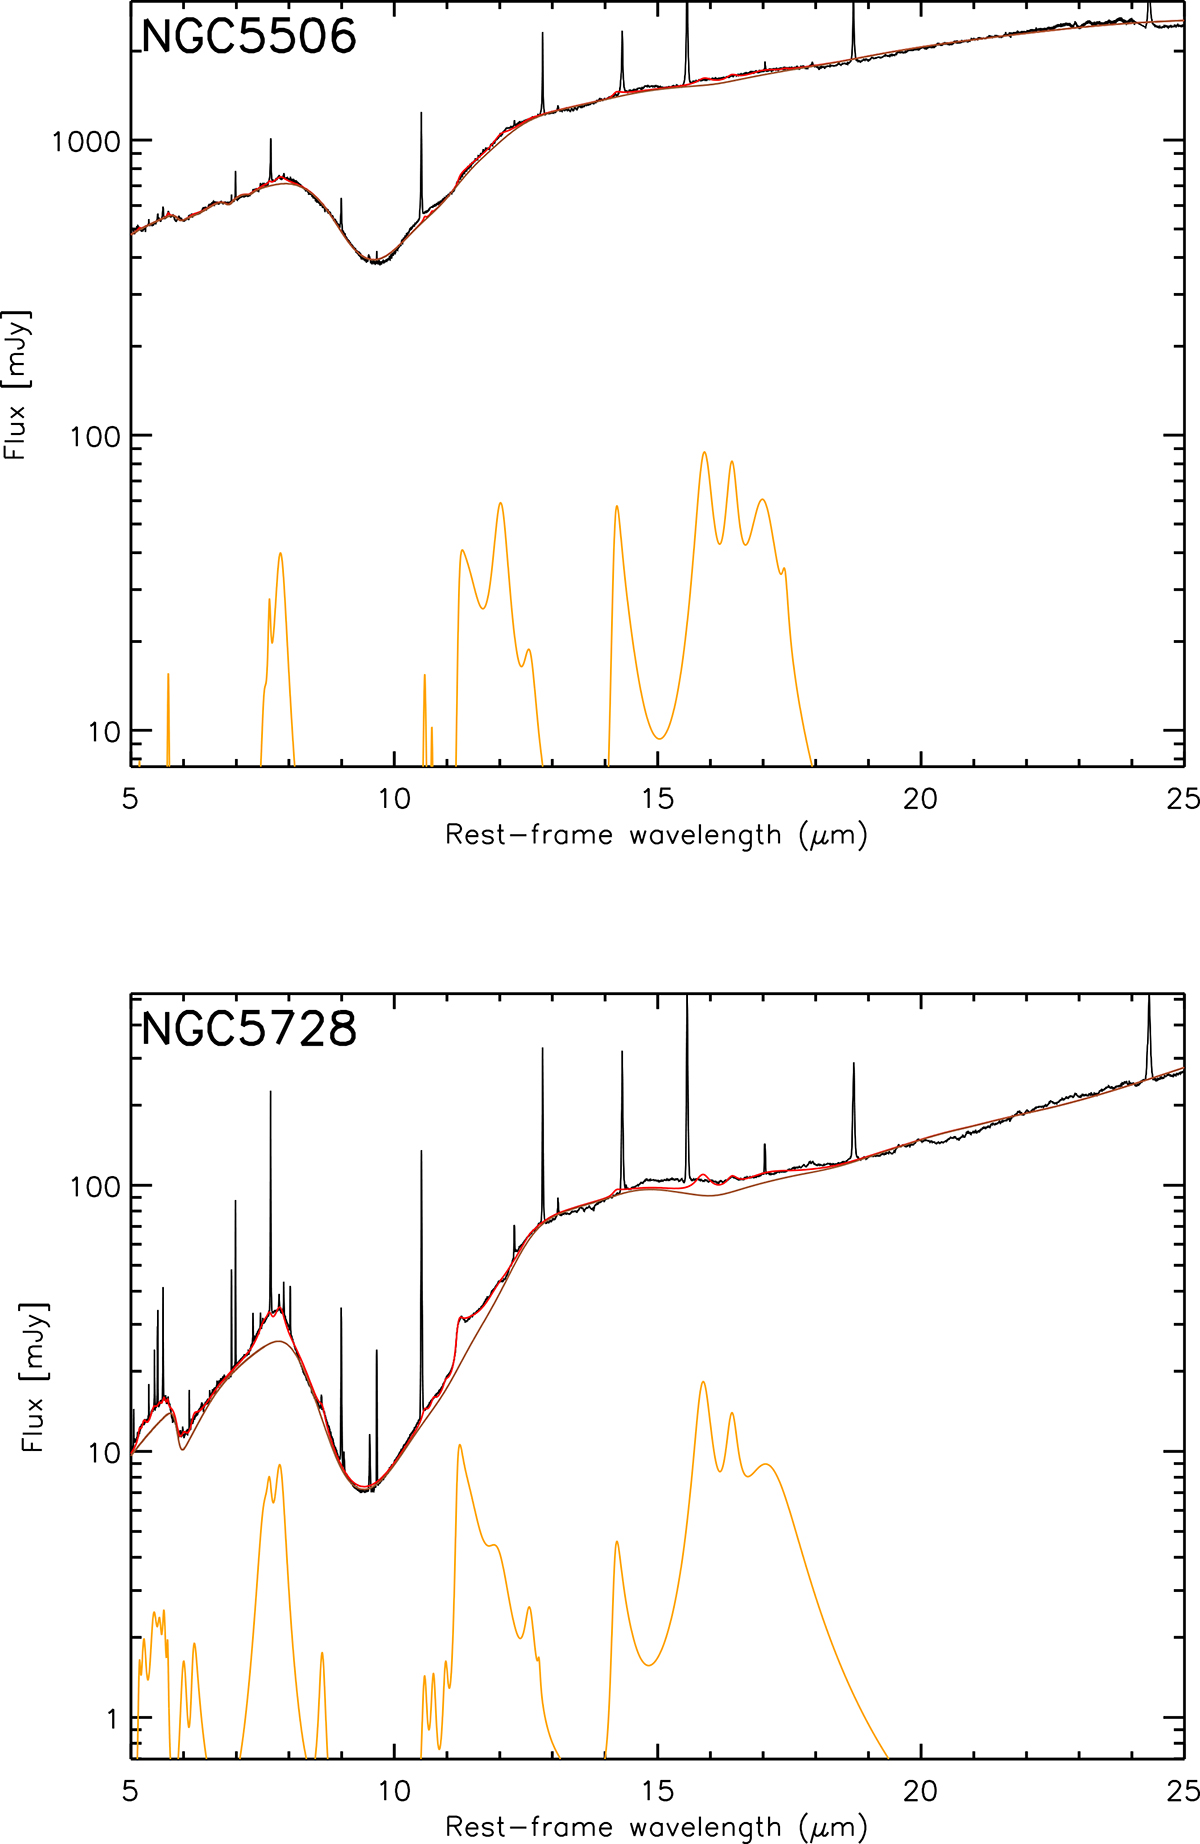
Mid-IR spectral modelling of the nuclear regions of NGC 5506 (top panel) and NGC 5728 (bottom panel). The JWST/MRS rest-frame spectra and model fits correspond to the black and red solid lines. We show the continuum (brown solid lines) and the fitted PAH features (orange solid lines). Note that NGC 7172 does not show nuclear PAH emission and, thus, it is not included in this plot.
Current usage metrics show cumulative count of Article Views (full-text article views including HTML views, PDF and ePub downloads, according to the available data) and Abstracts Views on Vision4Press platform.
Data correspond to usage on the plateform after 2015. The current usage metrics is available 48-96 hours after online publication and is updated daily on week days.
Initial download of the metrics may take a while.