Fig. 1
Download original image
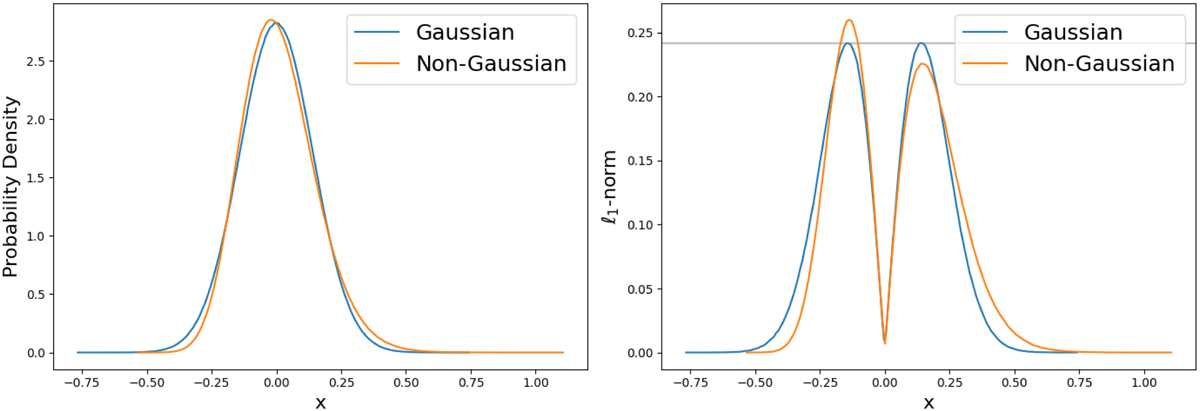
Probability density function and ℓ1-norm for a Gaussian distribution (blue) and the non-Gaussian distribution (orange). On the left, we present the PDF for the two distributions, and on the right, we display the derived ℓ1-norm of these PDFs. The peak heights are the same for a Gaussian distribution, but this does not hold for a non-Gaussian PDF.
Current usage metrics show cumulative count of Article Views (full-text article views including HTML views, PDF and ePub downloads, according to the available data) and Abstracts Views on Vision4Press platform.
Data correspond to usage on the plateform after 2015. The current usage metrics is available 48-96 hours after online publication and is updated daily on week days.
Initial download of the metrics may take a while.