Fig. 6.
Download original image
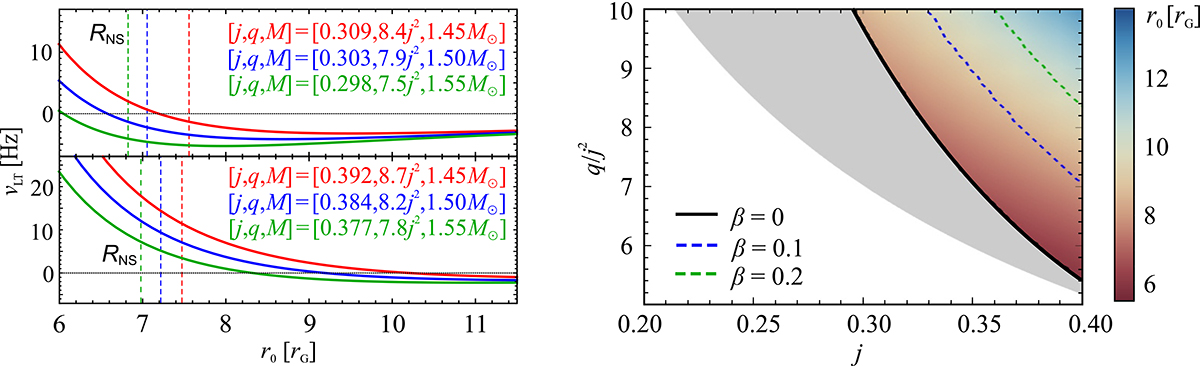
Impact of the equation of state on the vanishing of vertical precession frequency. Left: Profiles of the vertical precession frequency of the slender torus for a particular choice of space-time parameter values, along with the related NS radii calculated using the L NS EoS (Pandharipande & Smith 1975) and denoted by dashed vertical lines. The top (bottom) panel corresponds to a rotational frequency of 400 Hz (500 Hz). Right: Range of the Hartle-Thorne space-time parameters in which the vertical precession can change orientation. The thick black line marked β = 0 indicates the limiting NS parameters relevant for the case of a slender torus, which are the same as for the geodesic (thin-disc) case explored by Tsang & Pappas (2016). The shaded region below the β = 0 line is the area in which this effect can occur, but the corresponding torus overlaps with the NS surface. The coloured region above the β = 0 line corresponds to tori that do not overlap with the star, and the colour scale indicates the radii of their centres for the slender-torus case. In full analogy, the lines for β = 0.1 and β = 0.2 show the limiting parameters where the torus of the corresponding thickness would touch the NS surface. In these cases, the corresponding r0 colour maps would be slightly different but still almost identical to the β = 0 map shown in this figure.
Current usage metrics show cumulative count of Article Views (full-text article views including HTML views, PDF and ePub downloads, according to the available data) and Abstracts Views on Vision4Press platform.
Data correspond to usage on the plateform after 2015. The current usage metrics is available 48-96 hours after online publication and is updated daily on week days.
Initial download of the metrics may take a while.