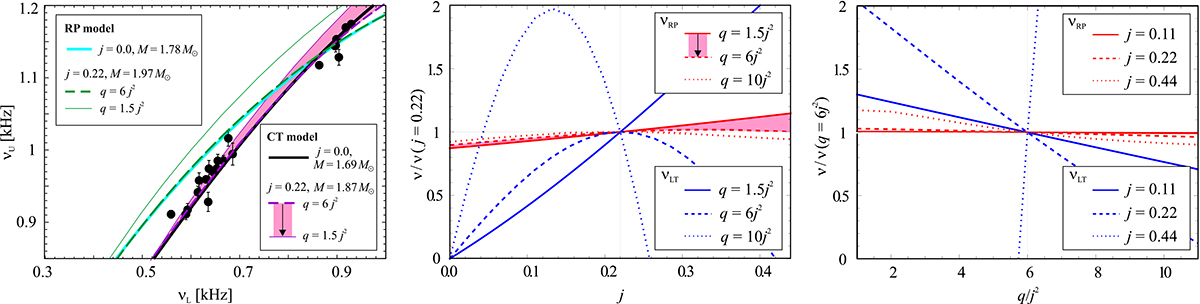
Fig. 5.
Download original image
Response of precession frequencies to changes in NS parameters. Left: Correlations between the lower and upper QPO frequencies, νL and νU, predicted by the CT and RP models, compared to the observed data from the atoll source 4U 1636−53. The best fits predicted for non-rotating NSs are denoted by thick solid lines, while the best fits for moderately rotating NSs with j = 0.22 and q = 6j2 are denoted by dashed lines. The thin solid lines show these values of M and j but different values of q (q = 1.5j2). For the CT model, the light-coloured region emphasises the change in the frequencies predicted by the model with changing q. Middle: Relative change in the cusp torus precession frequencies with angular momentum at the radius where νRP = 0.75 νK. Within the RP and CT models, this radius corresponds to the bottom-left group of data points shown in the left panel. The light-coloured region emphasises the corresponding change in νRP. Right: Relative change in the precession frequencies with the quadrupole parameter. The frequencies are calculated at the same radius as in the middle panel.
Current usage metrics show cumulative count of Article Views (full-text article views including HTML views, PDF and ePub downloads, according to the available data) and Abstracts Views on Vision4Press platform.
Data correspond to usage on the plateform after 2015. The current usage metrics is available 48-96 hours after online publication and is updated daily on week days.
Initial download of the metrics may take a while.