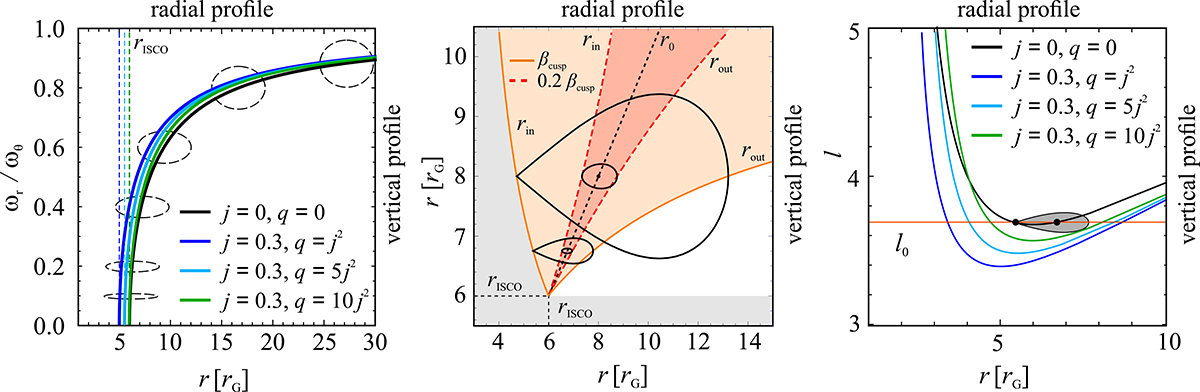
Fig. 1.
Download original image
Epicyclic frequencies and shape of tori. Left: epicyclic frequency ratio and shape of tori in the limit of β → 0. The dashed coloured vertical lines denote the locations of the ISCO calculated for different space-time parameters. The frequency-ratio values calculated for different space-time parameters at given radii are indicated by the coloured curves and labelled on the standard (left and bottom) axes. Several additional dashed ellipses, drawn for a non-rotating star (j = 0) and described by the upper and right axes, show the limiting cross-sections of slender tori located at a radius marked by the (common) lower axis. Middle: radial extension and shape of a torus with its centre located at radius r0 in the case of a non-rotating NS (j = 0). The dependence of the inner (rin) and outer (rout) torus radii on r0 is marked by orange (β = βcusp) and red (β = 0.2 βcusp) curves. Equipotential curves (black contours) are shown for two torus centre locations, r0 = 6.75 rG and r0 = 8 rG. The torus radial profile coordinates are identical to those on the bottom axes. Right: profiles of Keplerian specific angular momentum, l, corresponding to the same space-time parameters as in the left panel. The red horizontal line denotes a particular (chosen) value of l0. The shape of the cusp torus corresponding to this value of l0 and j = 0 is shown. As in the middle panel, the torus radial profile coordinates are identical to those on the bottom axis. The shape of equipotentials for the same value of l0 and the same space-time parameters is shown in Fig. 4.
Current usage metrics show cumulative count of Article Views (full-text article views including HTML views, PDF and ePub downloads, according to the available data) and Abstracts Views on Vision4Press platform.
Data correspond to usage on the plateform after 2015. The current usage metrics is available 48-96 hours after online publication and is updated daily on week days.
Initial download of the metrics may take a while.