Fig. 9.
Download original image
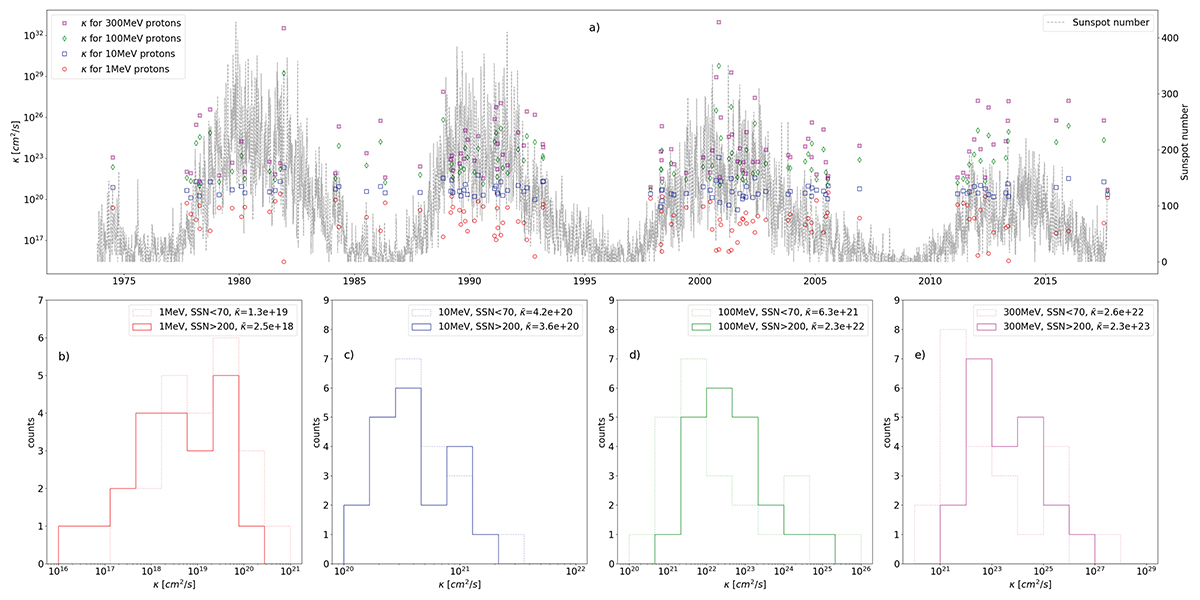
Solar-cycle dependent diffusion coefficient of different energies. Panel a shows the solar cycle evolution of the diffusion coefficient (left y-axis), which is defined by Eq. (6), for four different energies of protons (left legends). The gray lines in the background represent the daily sunspot number as scaled by the right y-axis. Panels b, c, d, and e show the diffusion coefficient distribution of 10, 50, 100, and 300 MeV protons, respectively. The distributions for low solar activity are represented by the dashed line, and for high solar activity are represented by the solid line. The median value of the diffusion coefficient, ![]() , for each distribution is also displayed in the legends.
, for each distribution is also displayed in the legends.
Current usage metrics show cumulative count of Article Views (full-text article views including HTML views, PDF and ePub downloads, according to the available data) and Abstracts Views on Vision4Press platform.
Data correspond to usage on the plateform after 2015. The current usage metrics is available 48-96 hours after online publication and is updated daily on week days.
Initial download of the metrics may take a while.