Fig. 7.
Download original image
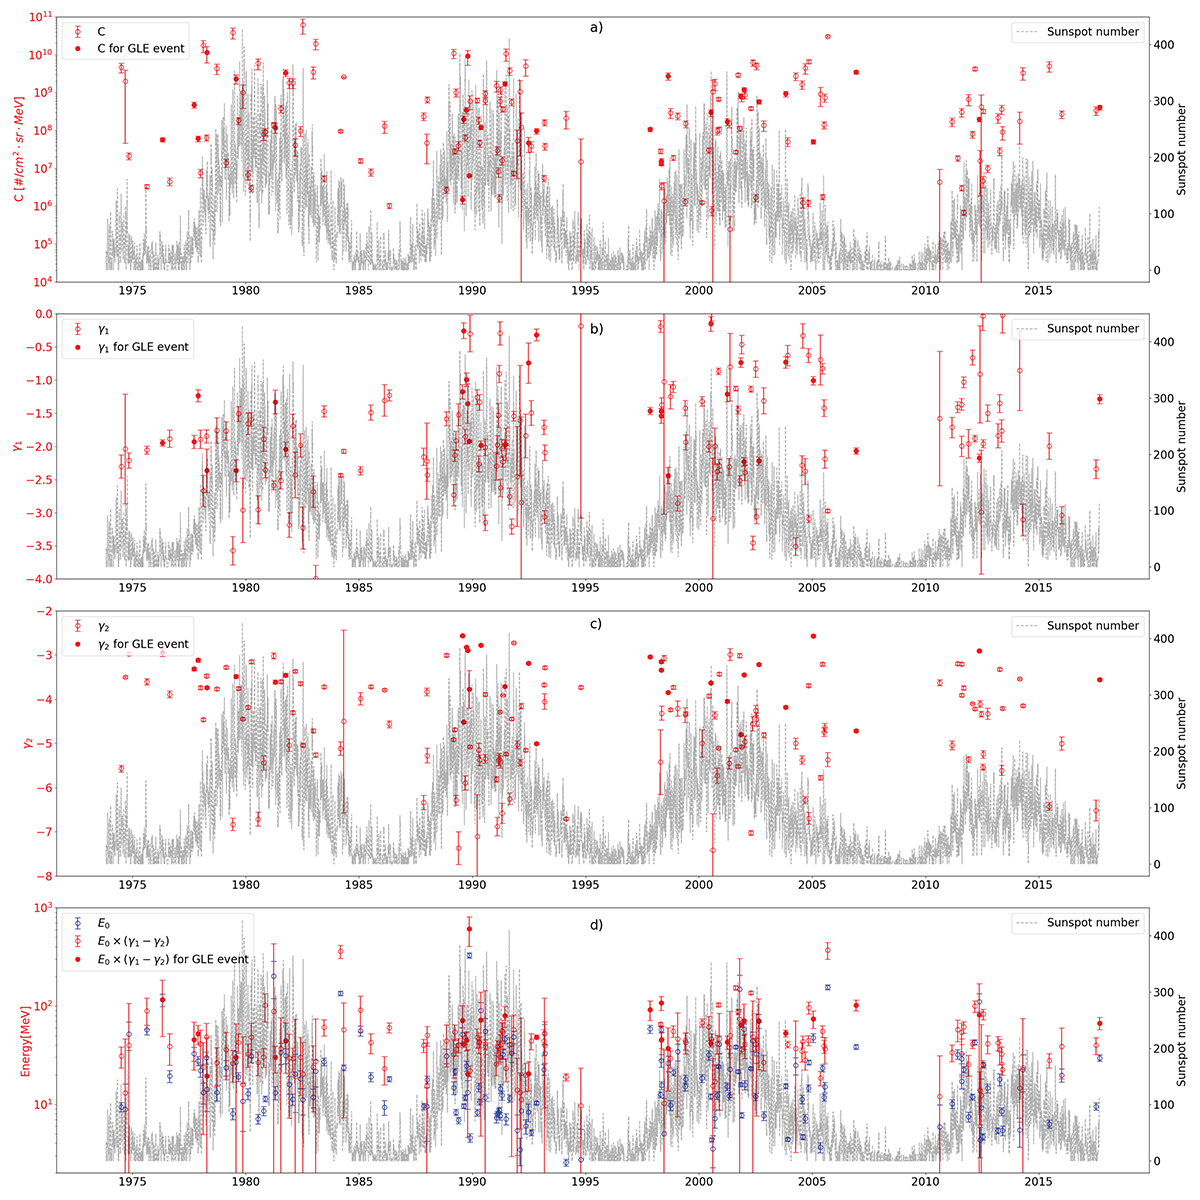
Solar-cycle evolution of four parameters in the integral fluence spectrum in Eq. (3), as shown by the left y-axes. The uncertainty of each parameter results from assuming a 5% uncertainty in the SEPEM dataset as mentioned in Sect. 3.1. Solid dots are parameters of GLE events. The black lines in the background represent the daily sunspot number as scaled by the right y-axes.
Current usage metrics show cumulative count of Article Views (full-text article views including HTML views, PDF and ePub downloads, according to the available data) and Abstracts Views on Vision4Press platform.
Data correspond to usage on the plateform after 2015. The current usage metrics is available 48-96 hours after online publication and is updated daily on week days.
Initial download of the metrics may take a while.