Open Access
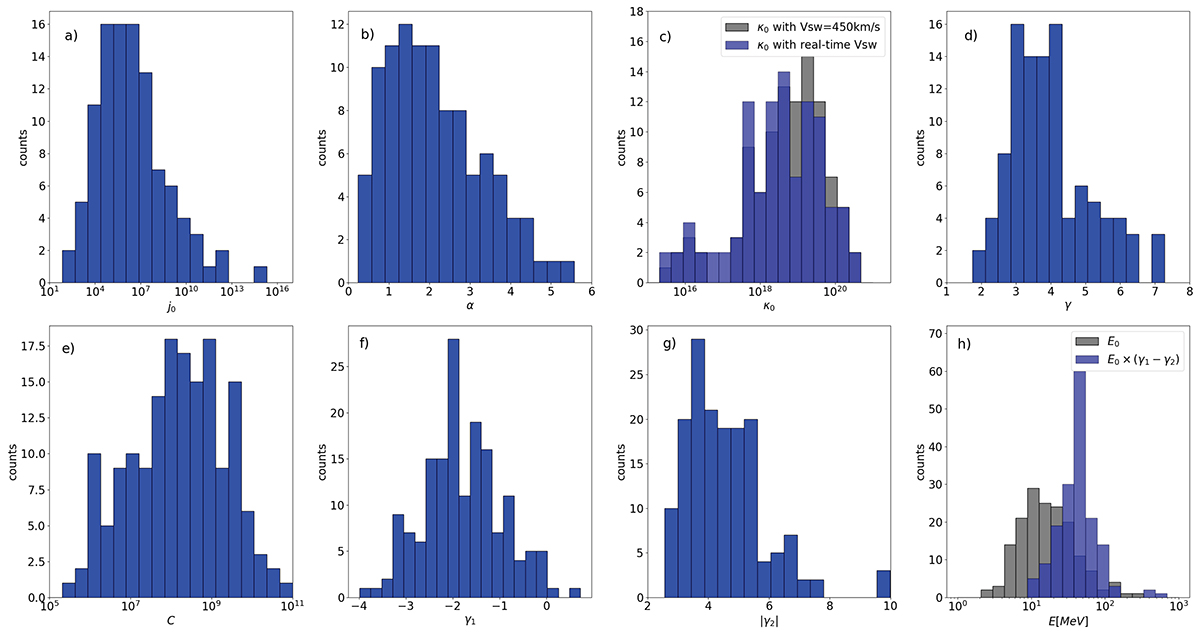
Fig. 4.
Download original image
Histograms of the fitting parameters shown in Tables 3 and 4. The results of the Anderson-Darling test are shown in Table 2, indicating that logC, γ1, and log E0 follow a normal distribution.
Current usage metrics show cumulative count of Article Views (full-text article views including HTML views, PDF and ePub downloads, according to the available data) and Abstracts Views on Vision4Press platform.
Data correspond to usage on the plateform after 2015. The current usage metrics is available 48-96 hours after online publication and is updated daily on week days.
Initial download of the metrics may take a while.