Fig. 2.
Download original image
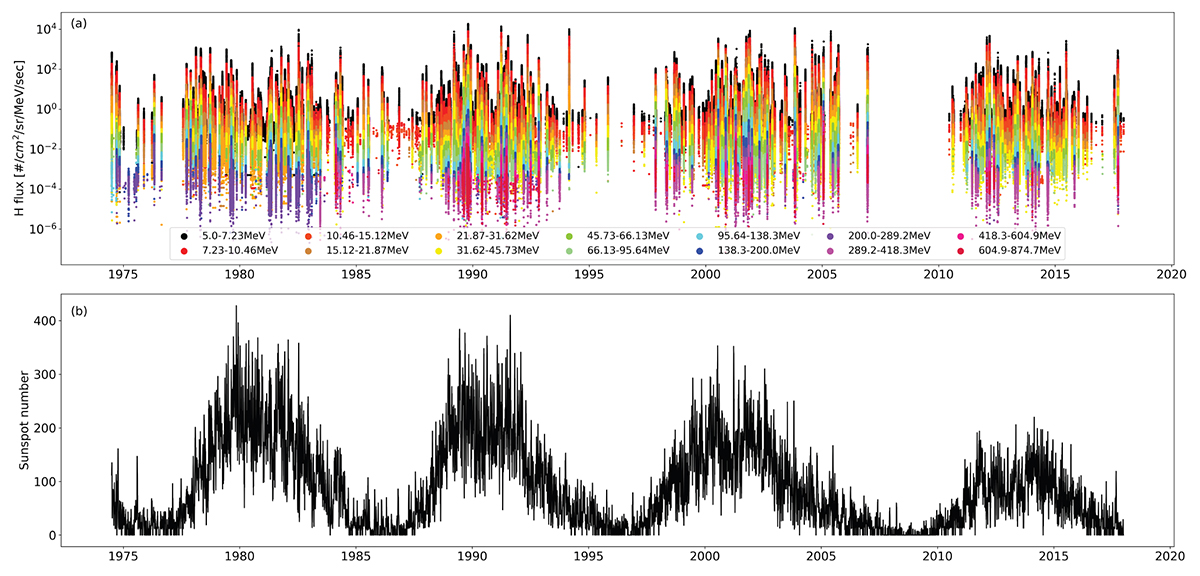
Occurrence of SEP events is related to the solar activity cycle. Panel a shows the entire SEPEM dataset used in this study, namely the SEP proton flux-time profile from July 1, 1974 to December 31, 2017. Each vertical colored strip represents an SEP event, with different colors indicating various energy bins. Panel b shows the corresponding daily sunspot number (SSN) for the same time duration. The frequency of SEP events is positively correlated with SSN indicating solar activities.
Current usage metrics show cumulative count of Article Views (full-text article views including HTML views, PDF and ePub downloads, according to the available data) and Abstracts Views on Vision4Press platform.
Data correspond to usage on the plateform after 2015. The current usage metrics is available 48-96 hours after online publication and is updated daily on week days.
Initial download of the metrics may take a while.