Fig. 10.
Download original image
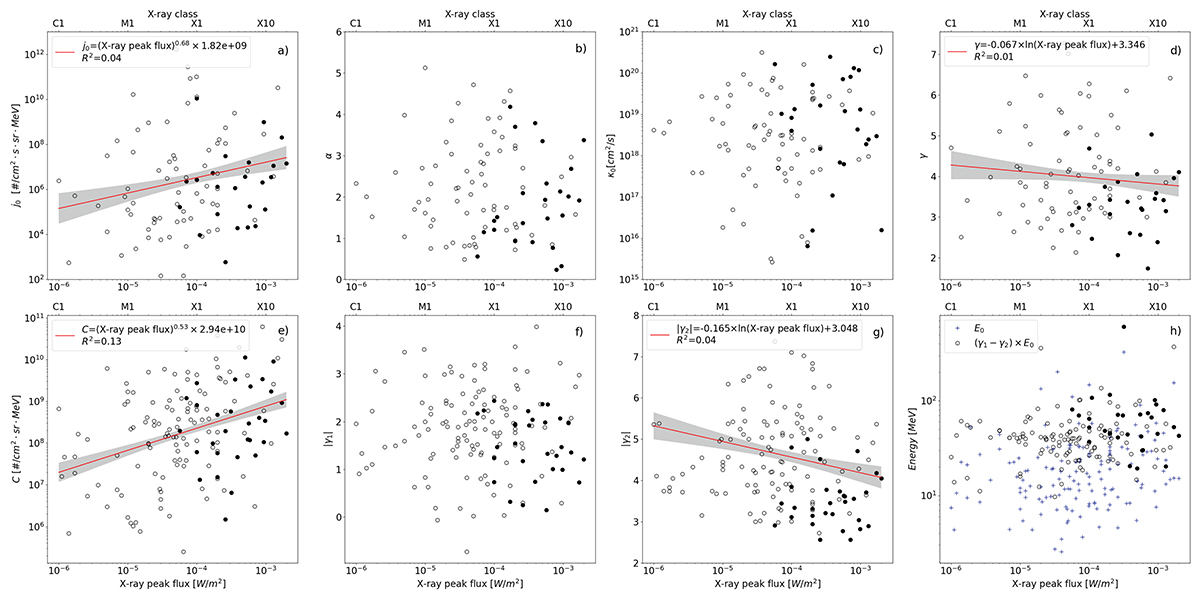
Relationship between the energy spectrum parameters of the SEP event and the peak X-ray flux of the corresponding flare. Solid dots are parameters of GLE events, while parameters of other SEP events are represented by hollow circles. The red line represents the linear regression curve, and the corresponding linear regression equation is shown in the legend. The shaded area represents the confidence interval for one standard deviation.
Current usage metrics show cumulative count of Article Views (full-text article views including HTML views, PDF and ePub downloads, according to the available data) and Abstracts Views on Vision4Press platform.
Data correspond to usage on the plateform after 2015. The current usage metrics is available 48-96 hours after online publication and is updated daily on week days.
Initial download of the metrics may take a while.