Open Access
Fig. 9.
Download original image
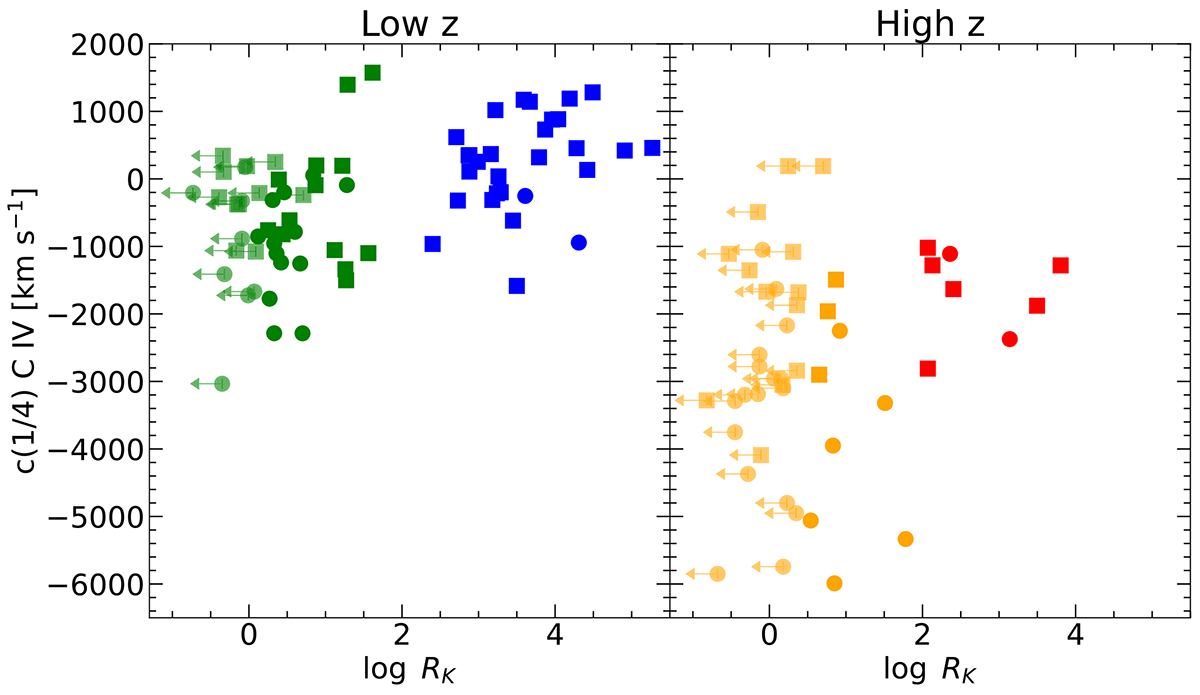
Relation between radio-loudness and the velocity centroid at one-quarter intensity of the C IVλ1549 emission line for low-z (left) and high-z (right) ranges. RK upper limits are indicated by arrows alongside the symbol. The color scheme is the same as in Fig. 4.
Current usage metrics show cumulative count of Article Views (full-text article views including HTML views, PDF and ePub downloads, according to the available data) and Abstracts Views on Vision4Press platform.
Data correspond to usage on the plateform after 2015. The current usage metrics is available 48-96 hours after online publication and is updated daily on week days.
Initial download of the metrics may take a while.