Fig. 6.
Download original image
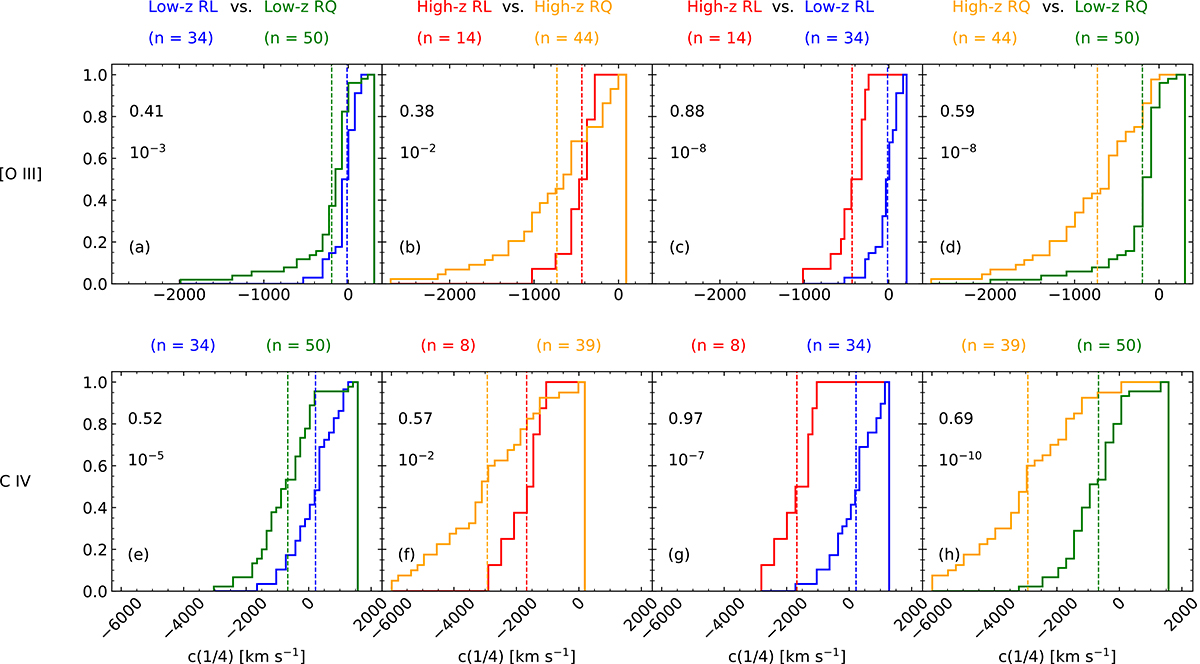
Centroid velocities at one-quarter intensity (c(1/4)) cumulative distributions of the samples separated by radio-loudness and redshift range for [O III]λ5007 (top panels) and C IVλ1549 (bottom panels). Kolmogórov-Smirnov tests were performed comparing different subsamples identified at the top of the panels. KS statistics for each comparison are shown in the top left corner of each plot together with the respective ρ-value. Vertical lines indicate the mean value for each subsample.
Current usage metrics show cumulative count of Article Views (full-text article views including HTML views, PDF and ePub downloads, according to the available data) and Abstracts Views on Vision4Press platform.
Data correspond to usage on the plateform after 2015. The current usage metrics is available 48-96 hours after online publication and is updated daily on week days.
Initial download of the metrics may take a while.