Fig. 2.
Download original image
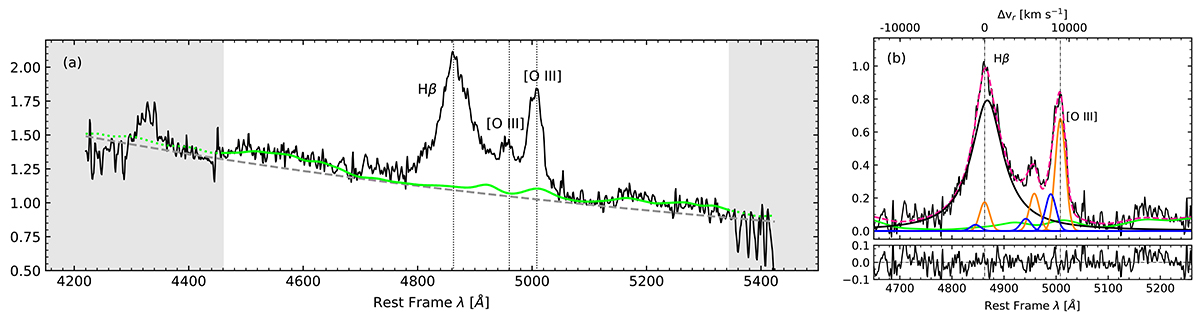
Example of an ISAAC spectrum and of the decomposition analysis of the emission lines. (a) Rest-frame optical spectrum of CTSJ01.03. The white area shows the spectral region used in the fitting. The gray dashed line indicates the continuum level obtained with the specfit multicomponent fitting. Fe II contributions are represented by the green line. (b) Example of the Hβ+[O III] emission line decomposition (upper panel) and its respective residuals (bottom panel). Black, orange, and blue lines indicate the broad, the narrow, and the blueshifted components of the profile, respectively. The final fit is shown by the pink dashed line.
Current usage metrics show cumulative count of Article Views (full-text article views including HTML views, PDF and ePub downloads, according to the available data) and Abstracts Views on Vision4Press platform.
Data correspond to usage on the plateform after 2015. The current usage metrics is available 48-96 hours after online publication and is updated daily on week days.
Initial download of the metrics may take a while.