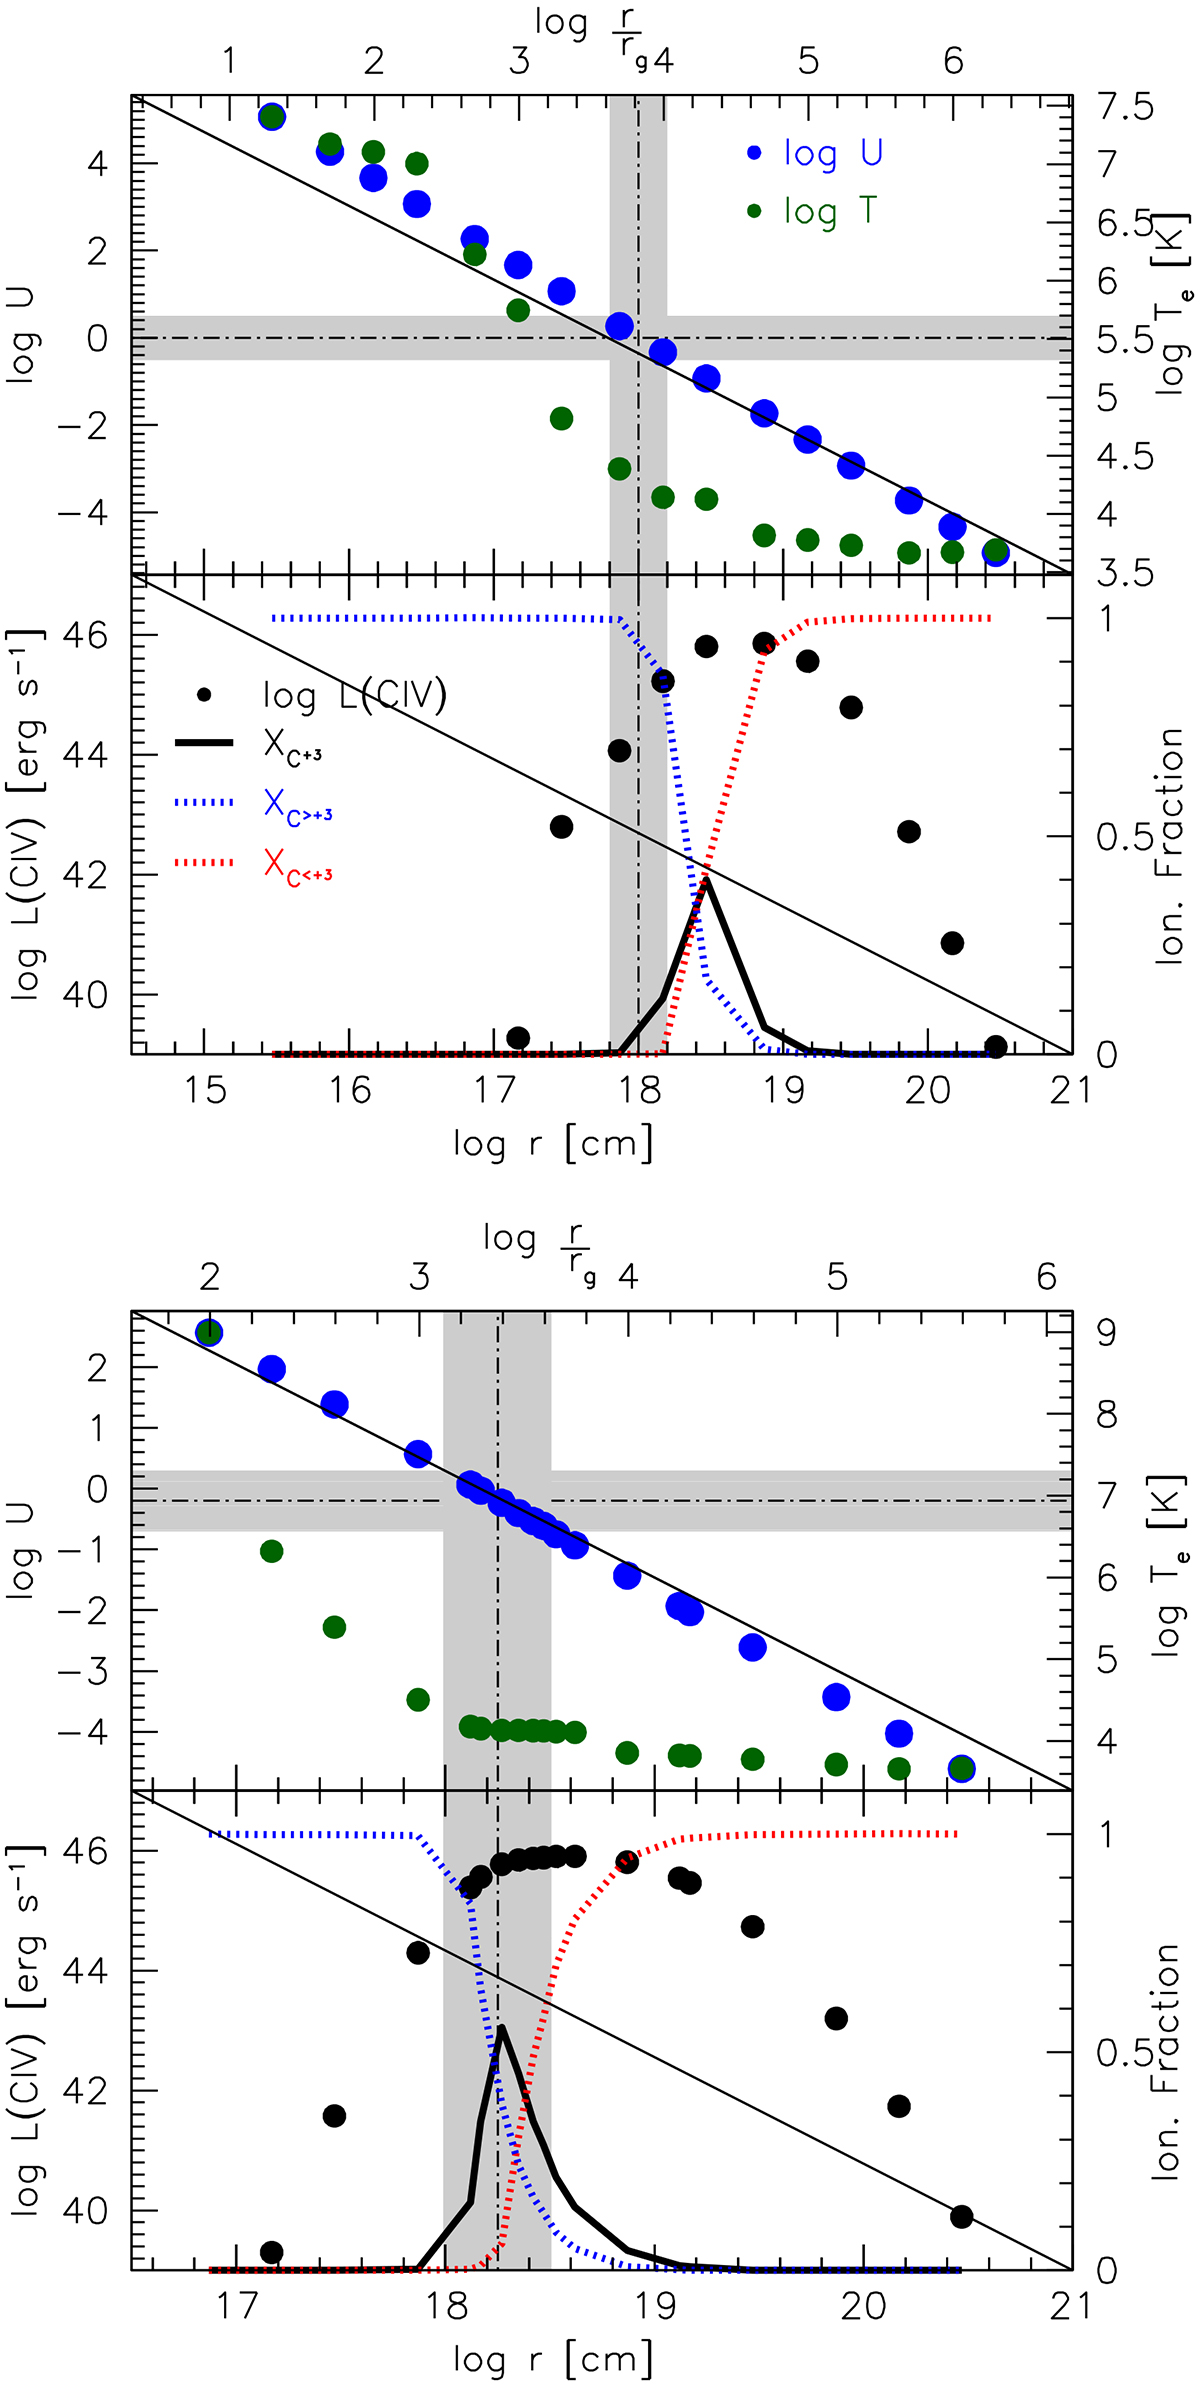
Fig. B.2.
Download original image
Behavior of ionization parameter, electron temperature, C IVλ1549 luminosity, and ionic fraction as a function of radius for density value log nH = 9.5 [cm−3], and for the two adopted SEDs for the low (top panels) and high-z (bottom panels) samples. Top, upper panel: behavior of the ionization parameter (left axis scale, blue dots) and electron temperature (right axis scale, green dots) as a function of radius for a MBH = 109 M⊙ radiating at Eddington limit and illuminating a slab of gas. We assume column density Nc = 1022 cm−2, Mathews & Ferland (1987) SED, and the metallicity five times solar in all cases. Top, lower panel: logarithm of C IVλ1549 luminosity (black dots) and ionic fraction as a function of radius. The blue and red line represent the ionic stages higher and lower than 3, respectively, and the black circles ionic stage 3. Bottom, upper and lower panels: same as top panels, for log MBH= 9.5 [M⊙], and SED from Krawczyk et al. (2013). In both the top and bottom panels, the horizontal gray bands indicate the range of ionization parameters consistent with the observed C IV equivalent width and the C IV/Hβ ratio. The vertical bands represent the corresponding range of permitted radii.
Current usage metrics show cumulative count of Article Views (full-text article views including HTML views, PDF and ePub downloads, according to the available data) and Abstracts Views on Vision4Press platform.
Data correspond to usage on the plateform after 2015. The current usage metrics is available 48-96 hours after online publication and is updated daily on week days.
Initial download of the metrics may take a while.