Fig. 13.
Download original image
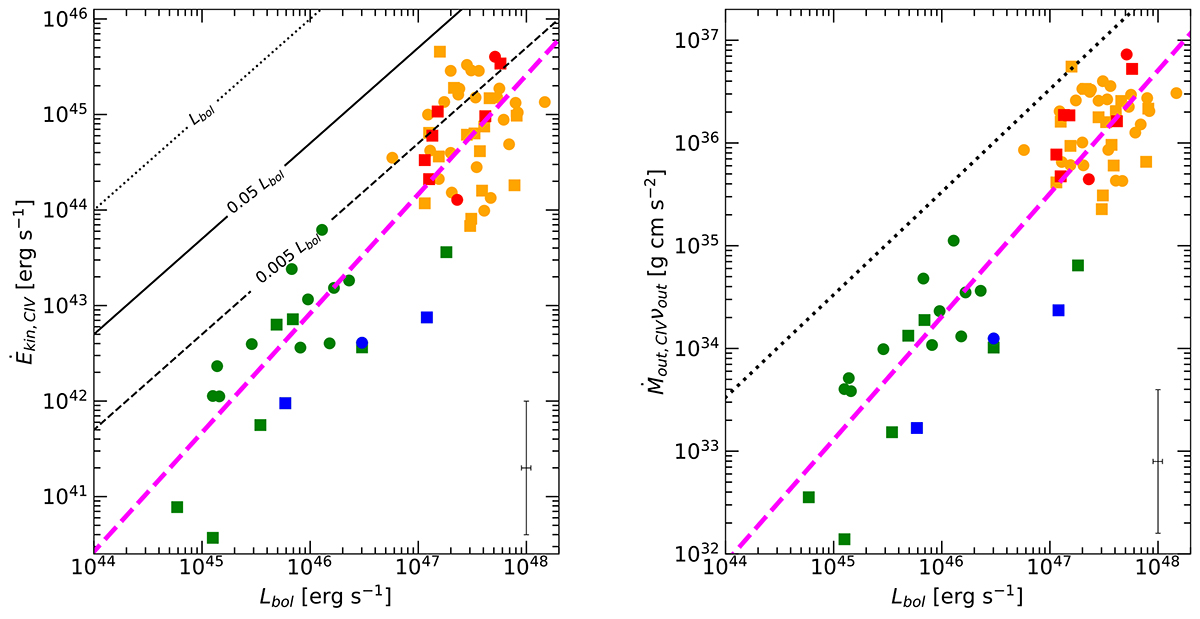
Kinetic power Ėkin (left plot) and thrust (right) vs. bolometric luminosity for the C IVλ1549 emission line. The two outflow parameters were estimated by varying the outflow radius depending on λLλ as defined in Kaspi et al. (2021). Magenta dashed lines indicate the least squares linear regression. Black dotted, continuous, and dashed lines show ![]() ,
, ![]() , and
, and ![]() respectively. The dotted line in the right panel indicates
respectively. The dotted line in the right panel indicates ![]() . Typical uncertainties are displayed in the bottom-right corner of the plots. The color scheme is the same as that in Fig. 4.
. Typical uncertainties are displayed in the bottom-right corner of the plots. The color scheme is the same as that in Fig. 4.
Current usage metrics show cumulative count of Article Views (full-text article views including HTML views, PDF and ePub downloads, according to the available data) and Abstracts Views on Vision4Press platform.
Data correspond to usage on the plateform after 2015. The current usage metrics is available 48-96 hours after online publication and is updated daily on week days.
Initial download of the metrics may take a while.