Fig. 11.
Download original image
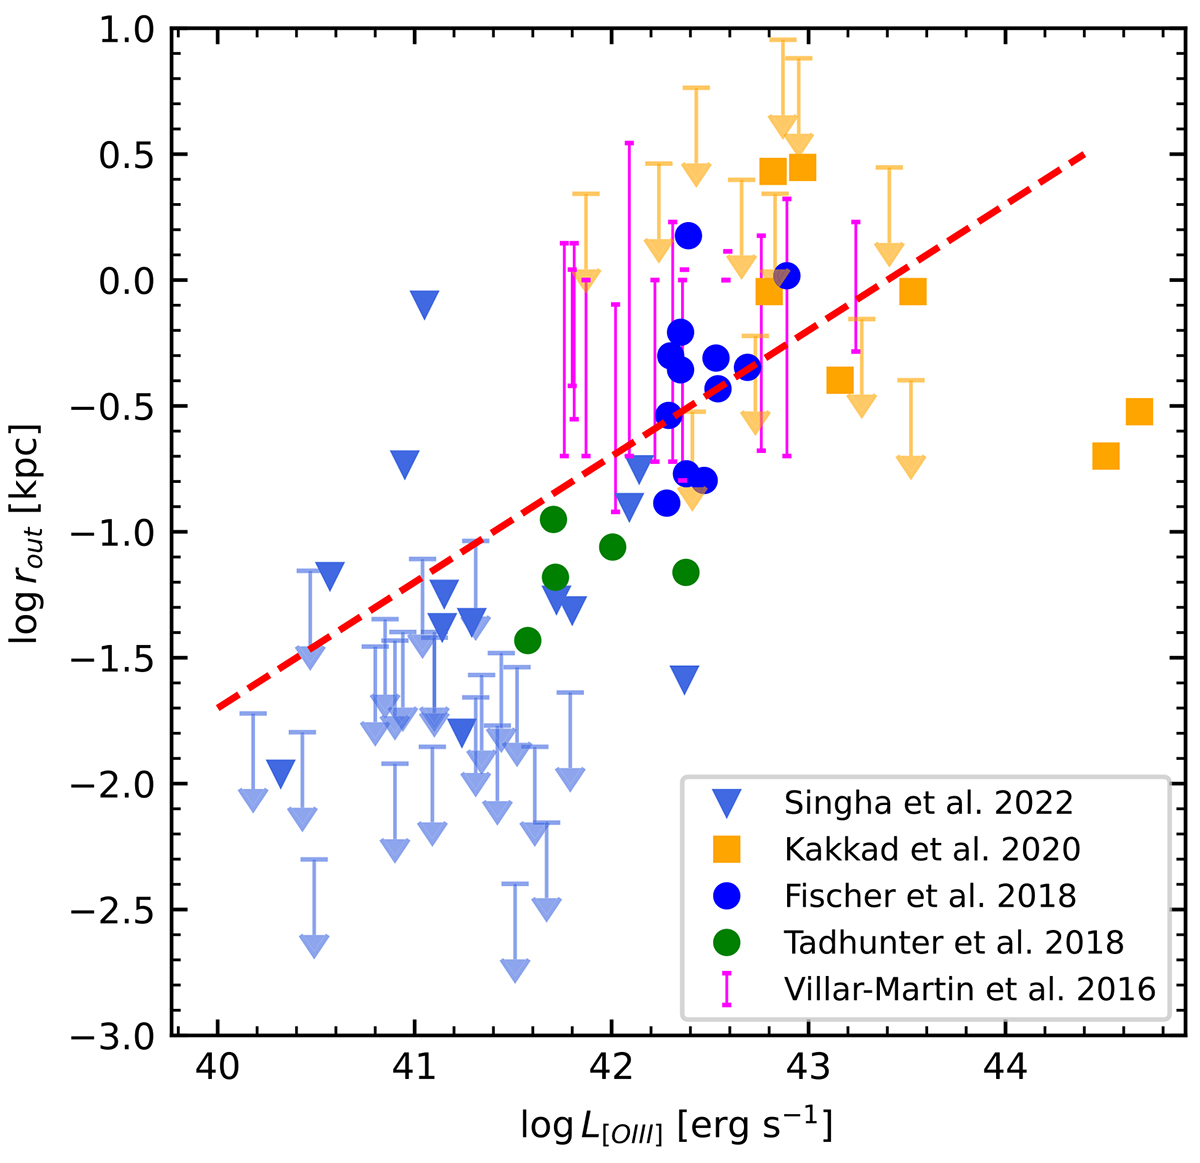
Relation between the outflow radio in kiloparsecs and the luminosity of the [O III]λ5007 emission line for the five plotted samples. The red dashed line represents the adopted least squares linear regression. Magenta vertical lines symbolise the minimum and maximum estimated radii in the Villar-Martin sample. Arrows correspond to upper limits.
Current usage metrics show cumulative count of Article Views (full-text article views including HTML views, PDF and ePub downloads, according to the available data) and Abstracts Views on Vision4Press platform.
Data correspond to usage on the plateform after 2015. The current usage metrics is available 48-96 hours after online publication and is updated daily on week days.
Initial download of the metrics may take a while.