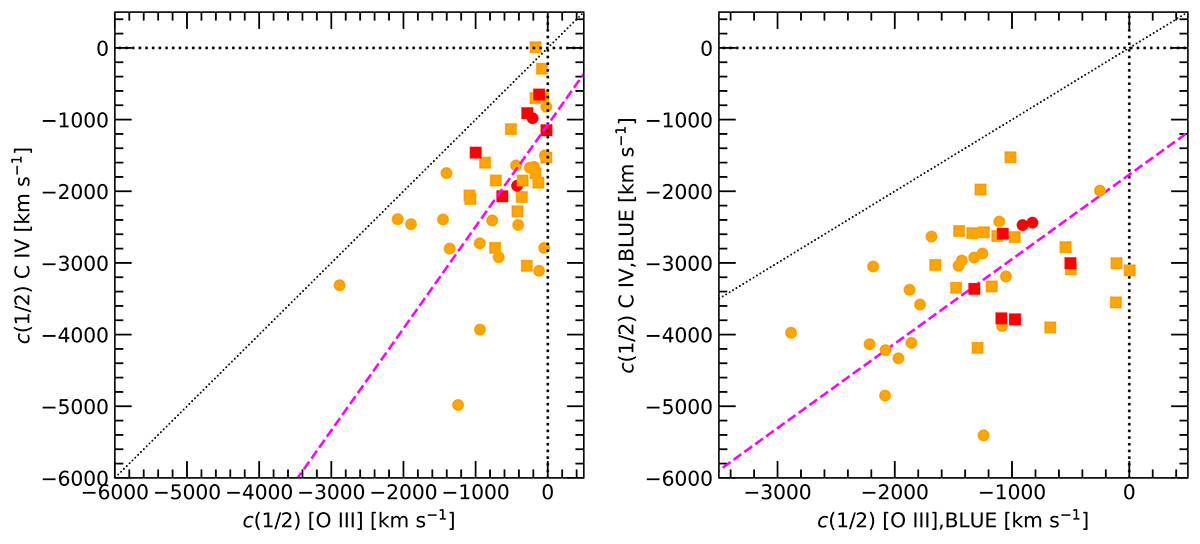
Fig. 10.
Download original image
Centroid velocity at half flux intensity (c(1/2)) of C IVλ1549 vs. c(1/2) of [O III]λ5007 for the full (left) and outflow (right) profiles of the high-z sample. The magenta lines indicate the linear regression between c(1/2) of C IV and [O III] for both cases obtained through the bisector method. Dotted black lines represent the 1:1 relation. The color scheme is the same as in Fig. 4.
Current usage metrics show cumulative count of Article Views (full-text article views including HTML views, PDF and ePub downloads, according to the available data) and Abstracts Views on Vision4Press platform.
Data correspond to usage on the plateform after 2015. The current usage metrics is available 48-96 hours after online publication and is updated daily on week days.
Initial download of the metrics may take a while.