Open Access
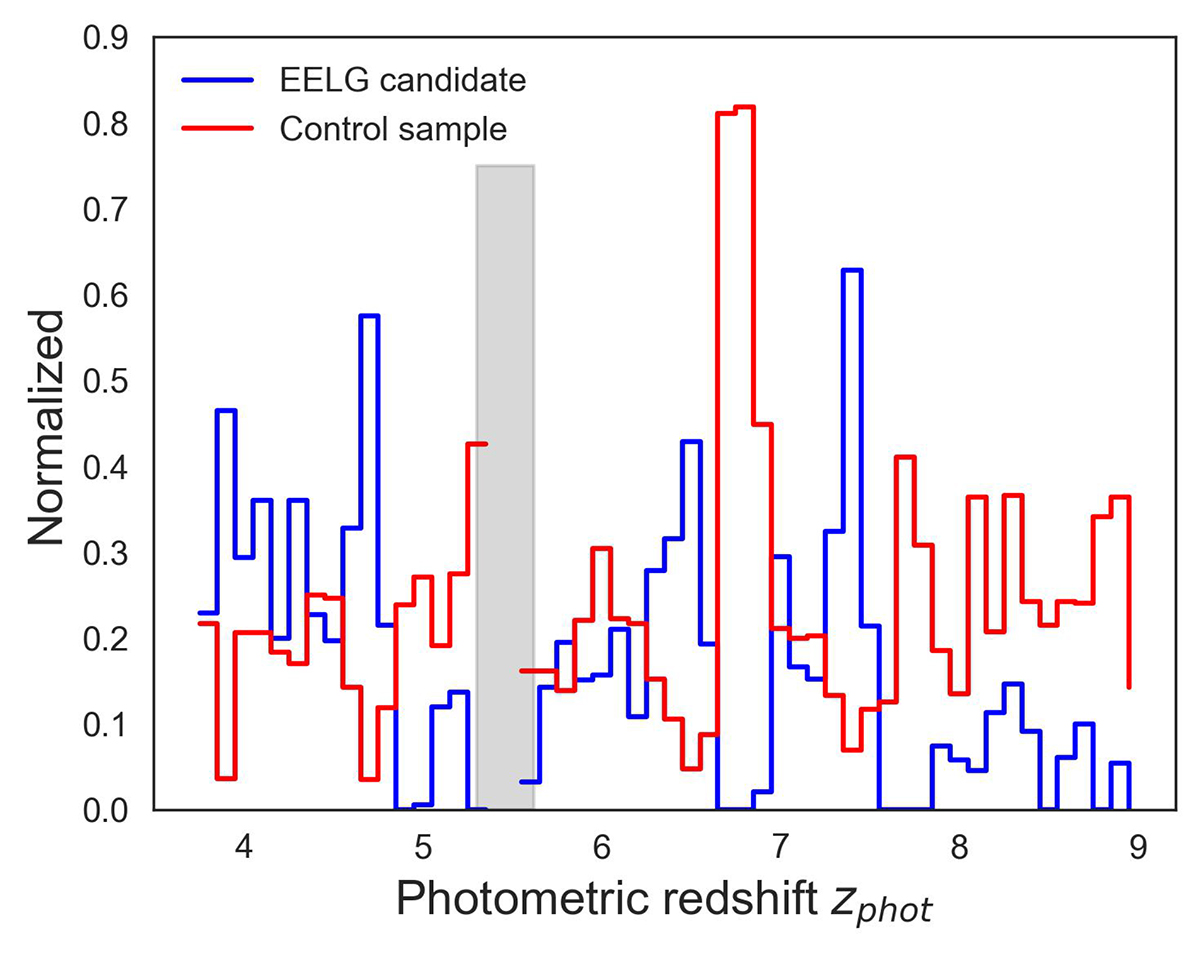
Fig. 8.
Download original image
Distribution of photometric redshift of the final sample of EELG candidates (in blue) and the control sample (in red). The gray-shaded region is the gap between the redshift range for selection. The normalization is made for the total of galaxies in the parent sample at similar redshift and S/N.
Current usage metrics show cumulative count of Article Views (full-text article views including HTML views, PDF and ePub downloads, according to the available data) and Abstracts Views on Vision4Press platform.
Data correspond to usage on the plateform after 2015. The current usage metrics is available 48-96 hours after online publication and is updated daily on week days.
Initial download of the metrics may take a while.