Open Access
Fig. 7.
Download original image
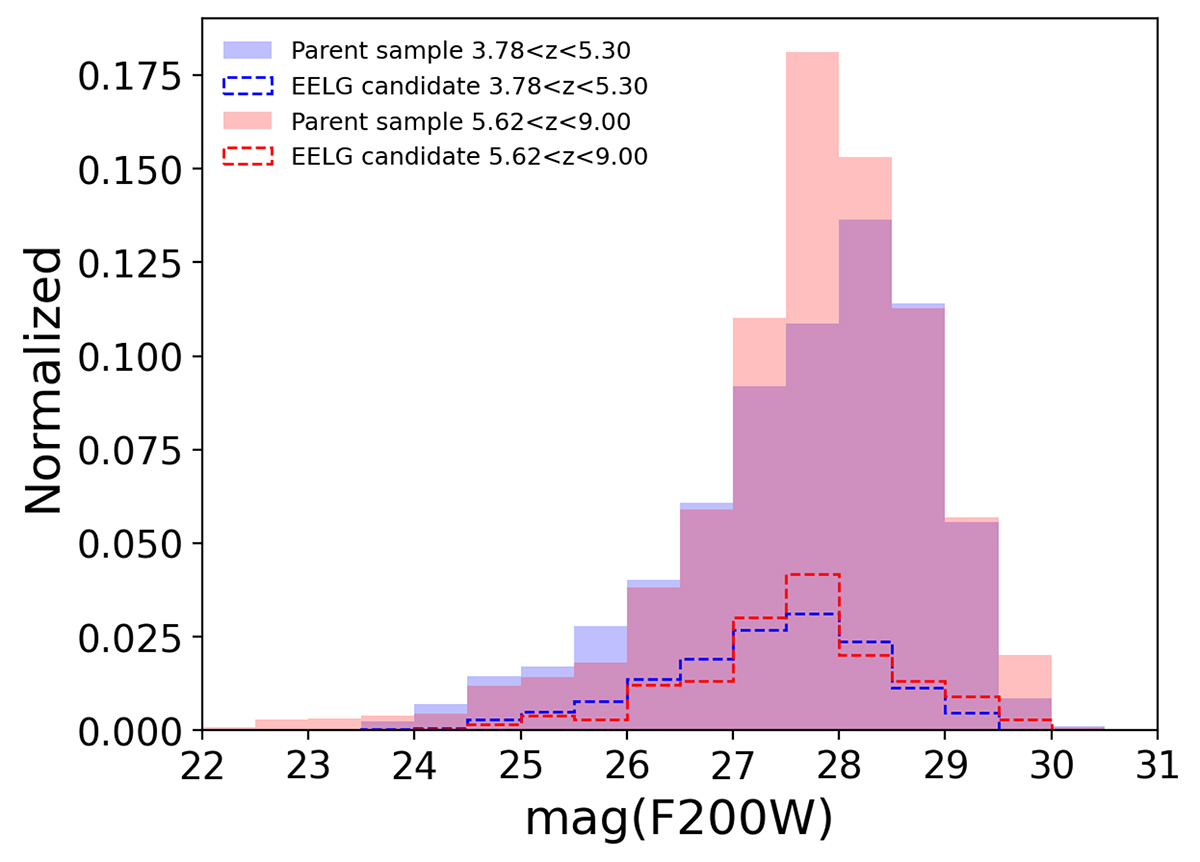
Distribution of the magnitude F200W for the sample of EELGs (unfilled histograms) and the parent samples at similar redshifts (filled histograms) in the two redshift ranges considered for the selection in blue and red, respectively. They are normalized to the total number of galaxies in each parent sample.
Current usage metrics show cumulative count of Article Views (full-text article views including HTML views, PDF and ePub downloads, according to the available data) and Abstracts Views on Vision4Press platform.
Data correspond to usage on the plateform after 2015. The current usage metrics is available 48-96 hours after online publication and is updated daily on week days.
Initial download of the metrics may take a while.