Fig. 5.
Download original image
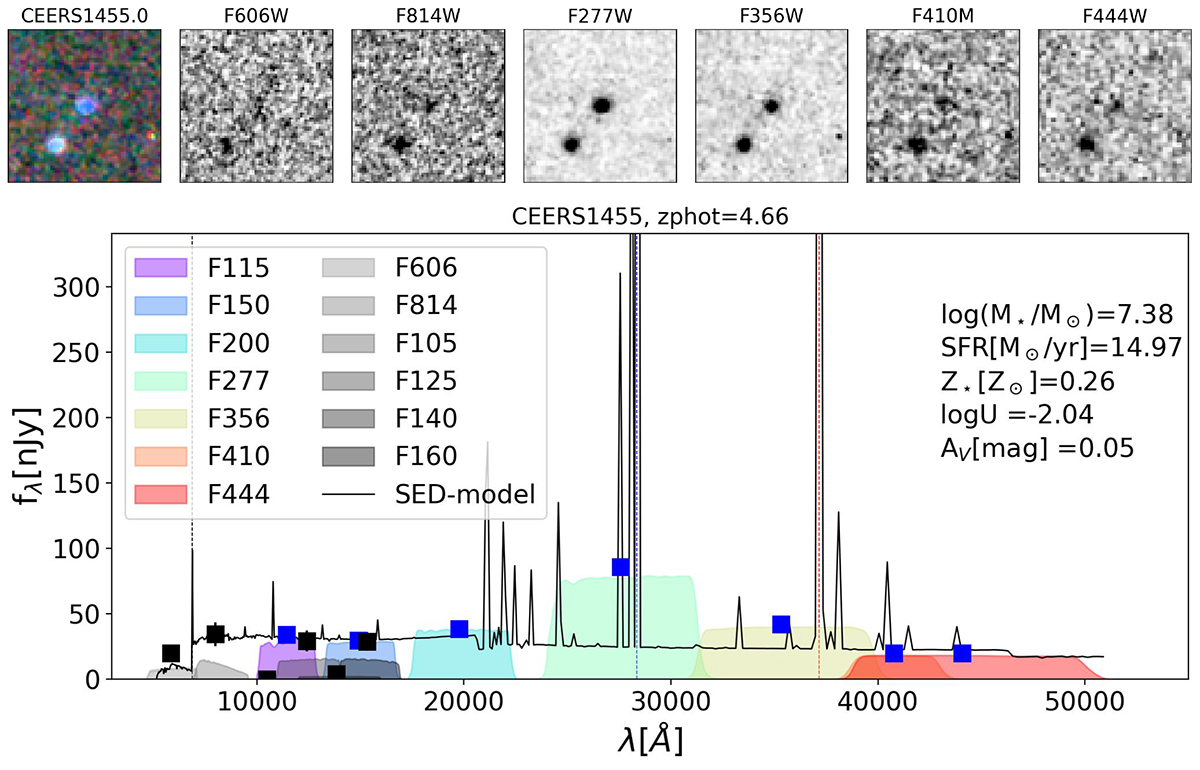
Images and SED of CEERS1455, an example of an EELG candidate at zphot = 4.66. In the top panels, images (4″ × 4″) of the galaxy in filters (from left to right) RGB image, HST/F606W, HST/F814W, JWST/F277W, JWST/F356W, JWST/F410M, and JWST/F444W. The RGB image is made with Red = F410M, Green = F356W, and Blue = F277W. On the bottom panel, SED of the galaxy. The blue (black) squares are the NIRCam (HST) photometric points. NIRCam (HST) filters are in rainbow-scale (gray-scale) colors, according to legend. The filter transmission is plotted in arbitrary units depending on the observed flux density. The black solid line is the SED model and the inset text summarizes its physical properties (see description in Sect. 3.2). The vertical dashed lines represent the position of Lyα (black), [OIII] (blue), and Hα (red), according to their zphot.
Current usage metrics show cumulative count of Article Views (full-text article views including HTML views, PDF and ePub downloads, according to the available data) and Abstracts Views on Vision4Press platform.
Data correspond to usage on the plateform after 2015. The current usage metrics is available 48-96 hours after online publication and is updated daily on week days.
Initial download of the metrics may take a while.