Fig. 4.
Download original image
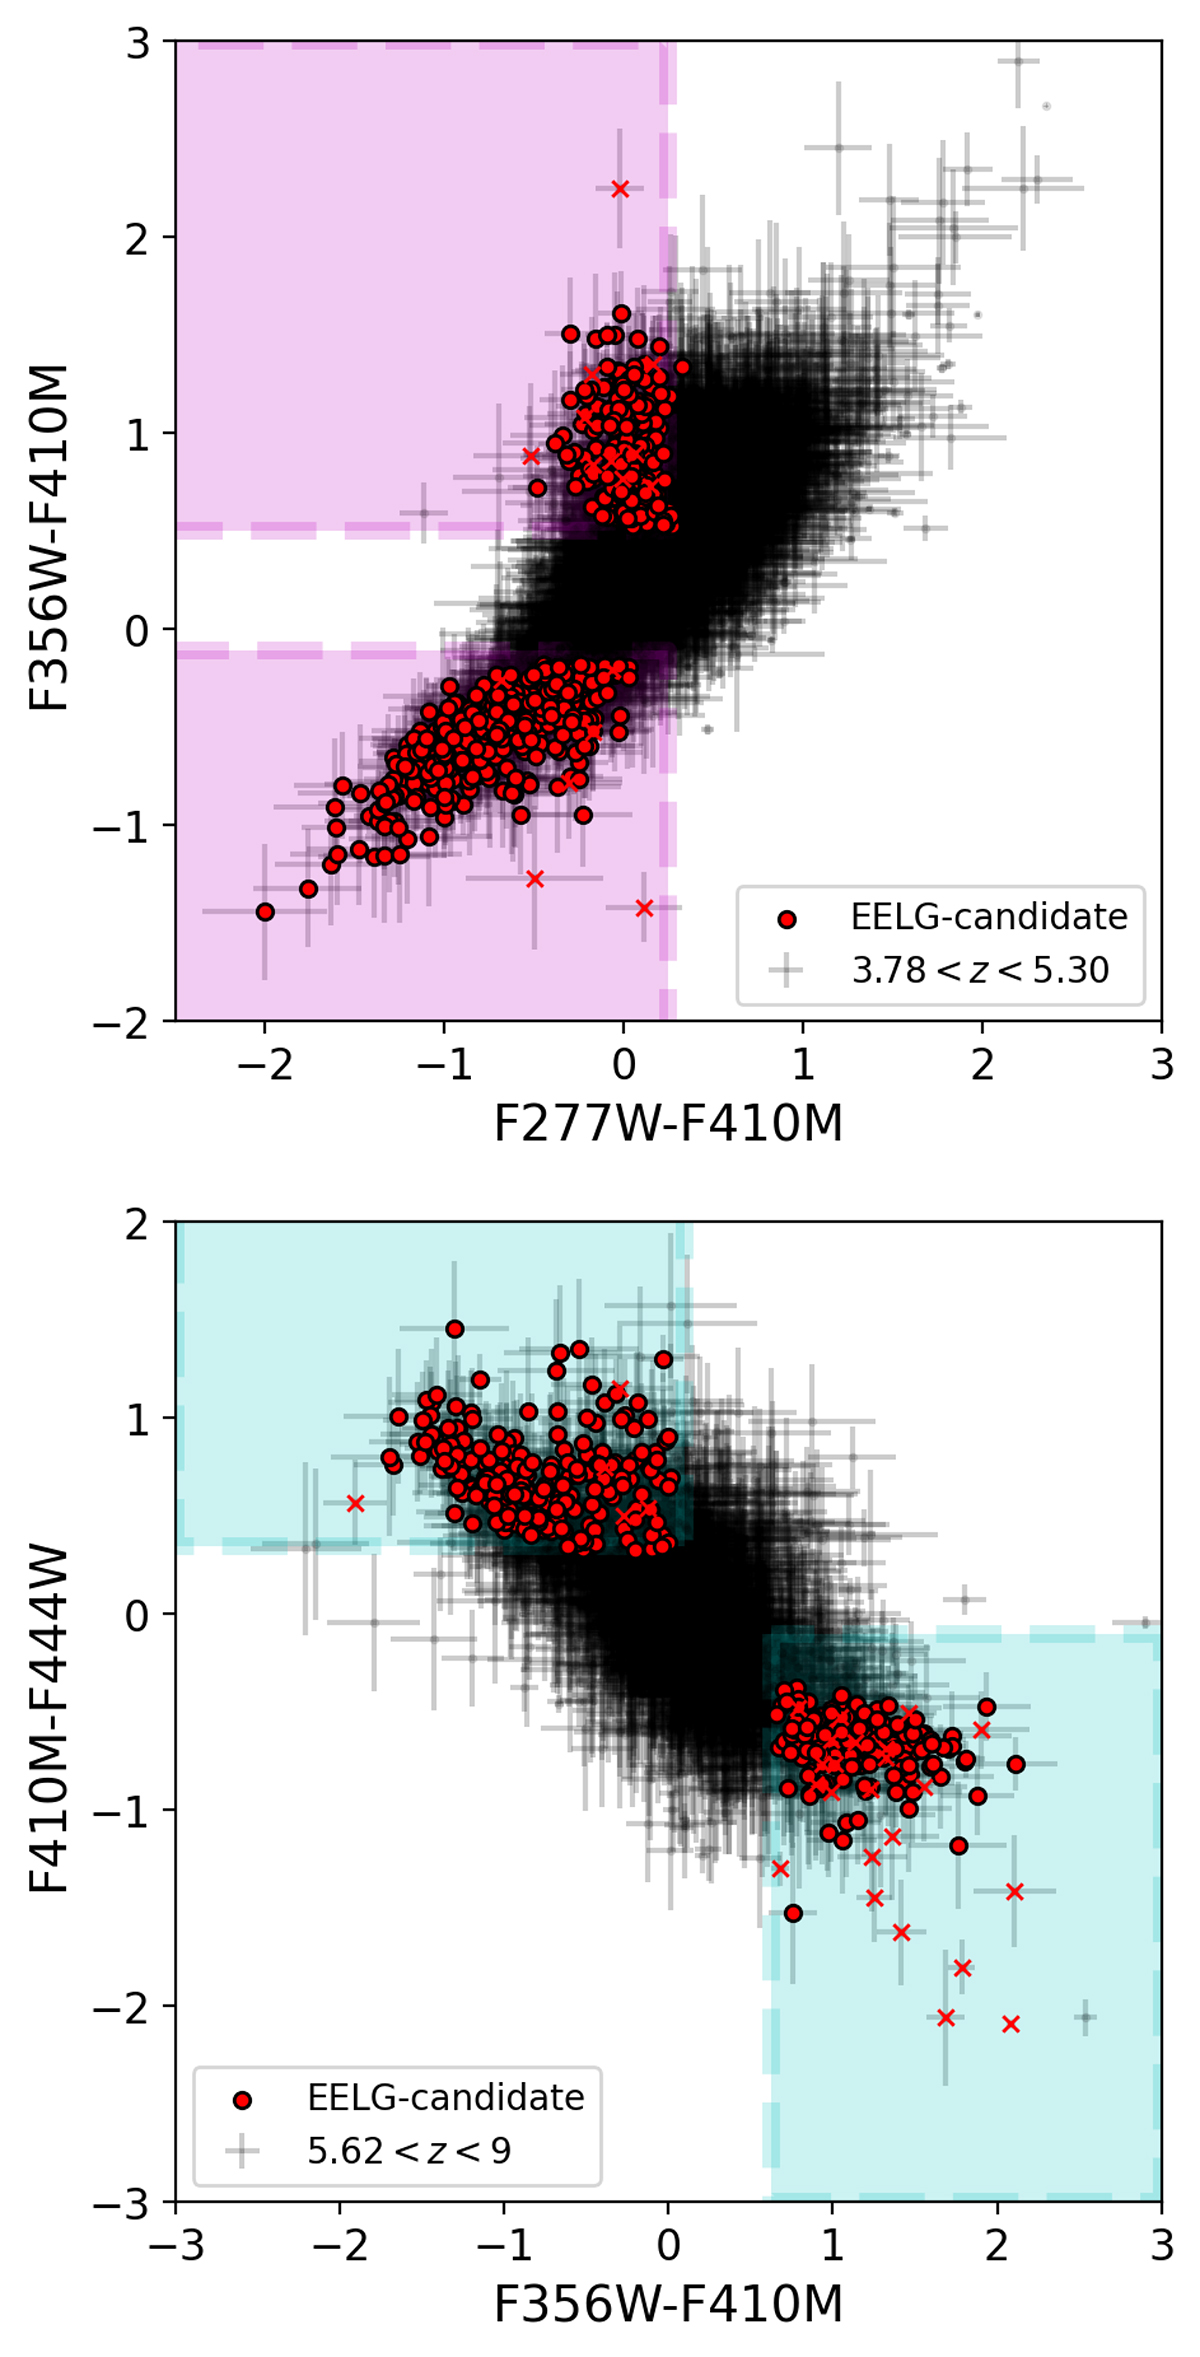
Color diagrams to select EELGs at each redshift range. The color cuts are marked in magenta (top panel) and cyan (bottom panel) shaded regions in each panel according to Eqs. (1) and (2), respectively. The selected EELG candidates are in red circles, while parent samples at similar redshifts are in black circles. The sources with red crosses were discarded due to contaminated photometry as explained in the main text.
Current usage metrics show cumulative count of Article Views (full-text article views including HTML views, PDF and ePub downloads, according to the available data) and Abstracts Views on Vision4Press platform.
Data correspond to usage on the plateform after 2015. The current usage metrics is available 48-96 hours after online publication and is updated daily on week days.
Initial download of the metrics may take a while.