Fig. 22.
Download original image
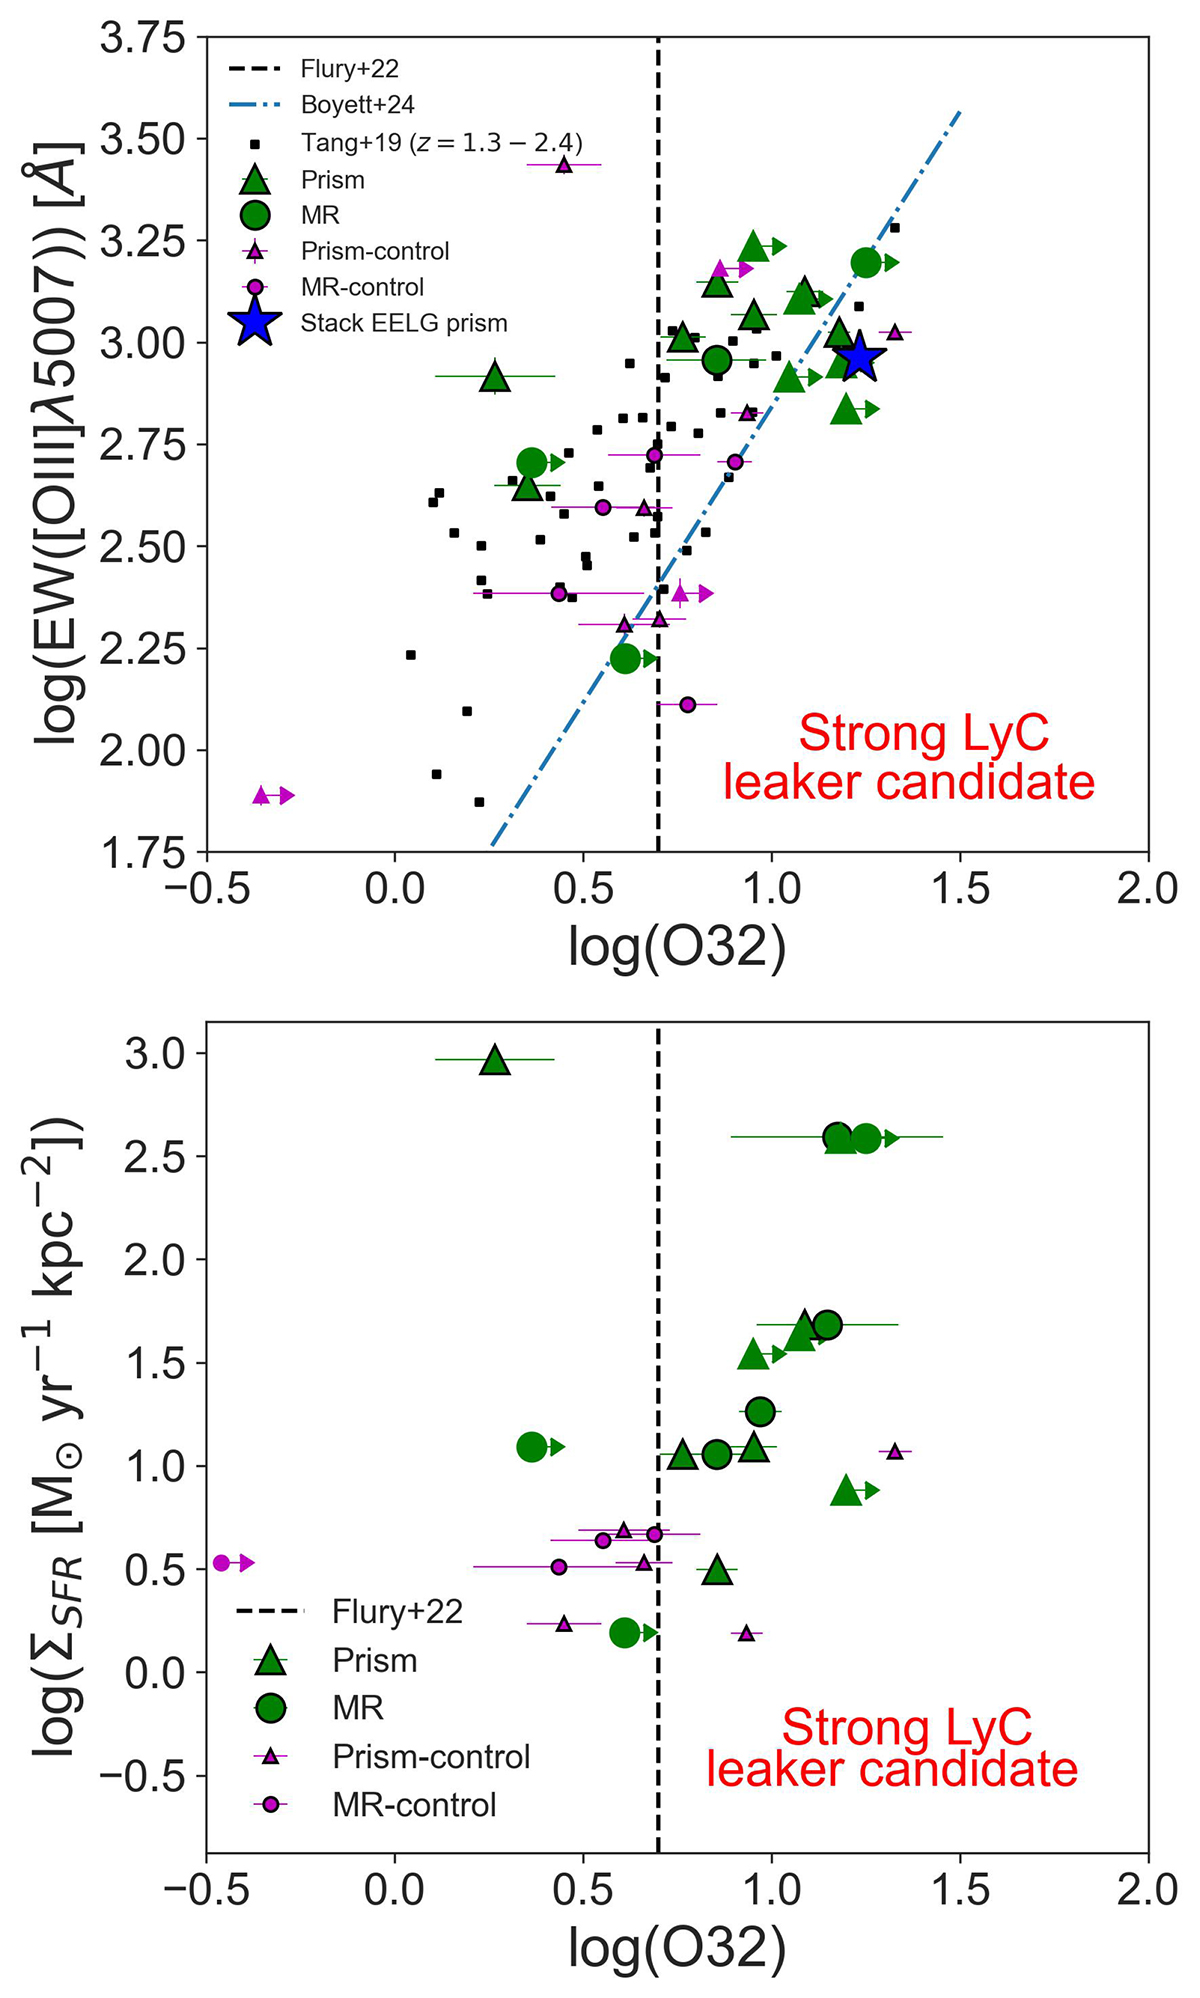
Relation between O32 and EW([OIII]λ5007) (top panel) and ΣSFR (bottom panel). We include lower limits due to the non-detection of [OII]. In green symbols, the sample of EELGs with NIRSpec spectra, while in magenta symbols, the control sample with NIRSpec spectra. The vertical dashed line is the separation between weak and strong LyC leaker according to Flury et al. (2022). On the top panel, black squares are a comparison sample at z = 1.3 − 2.4 (Tang et al. 2019), and the blue dashed-dotted line is the relation found in Boyett et al. (2024) for a sample of galaxies at z = 3 − 9.5.
Current usage metrics show cumulative count of Article Views (full-text article views including HTML views, PDF and ePub downloads, according to the available data) and Abstracts Views on Vision4Press platform.
Data correspond to usage on the plateform after 2015. The current usage metrics is available 48-96 hours after online publication and is updated daily on week days.
Initial download of the metrics may take a while.