Open Access
Fig. 21.
Download original image
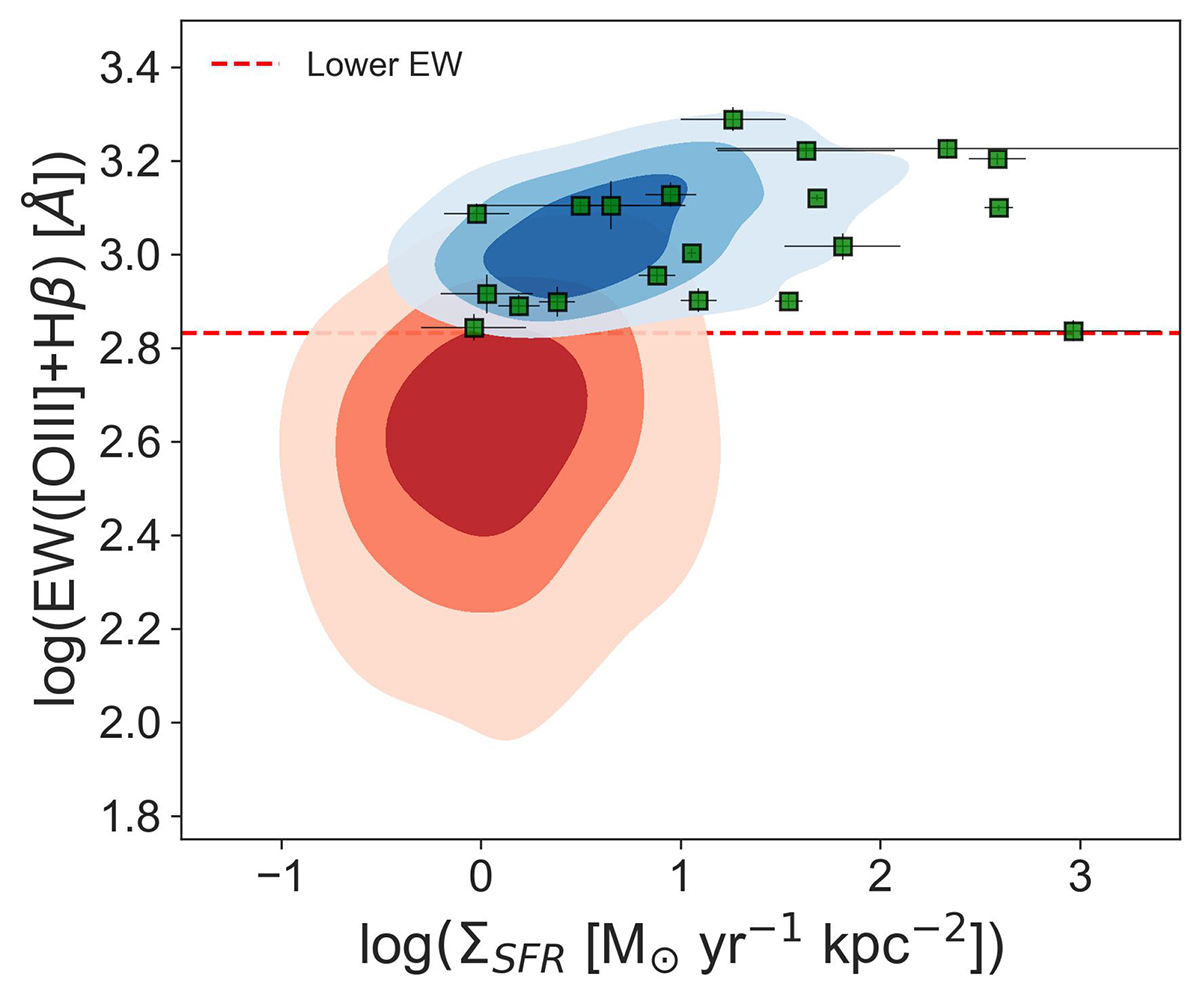
Relation between EW([OIII]+Hβ) and ΣSFR for the sample of EELGs and control sample (same as in Fig. 16). The green squares are the subsample of EELGs with NIRSpec spectra. The red dashed line is the lower EW limit of the ASK templates in this paper.
Current usage metrics show cumulative count of Article Views (full-text article views including HTML views, PDF and ePub downloads, according to the available data) and Abstracts Views on Vision4Press platform.
Data correspond to usage on the plateform after 2015. The current usage metrics is available 48-96 hours after online publication and is updated daily on week days.
Initial download of the metrics may take a while.