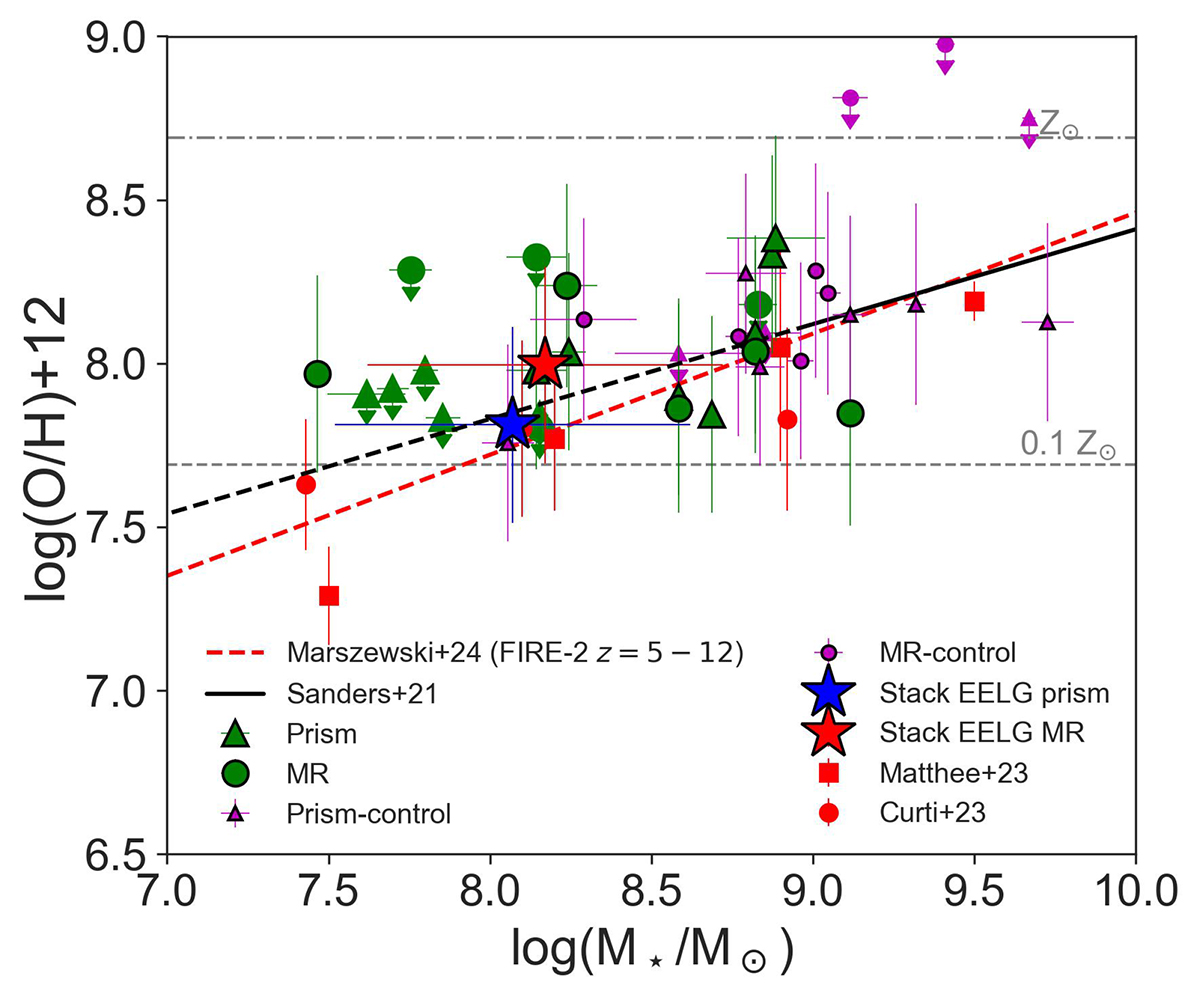
Fig. 20.
Download original image
Mass-Metallicity relation for EELGs. Individual galaxies of the EELG sample (control sample) are in green (magenta) symbols. Results from the stacks are represented with red (grating) and blue (prism) stars. Red squares are stacks at z ∼ 5 − 7 from Matthee et al. (2023) and red circles are stacks at z ∼ 3 − 10 from Curti et al. (2024). The black solid line is the MZR at z ∼ 3.3 from Sanders et al. (2021) and its extrapolation to lower stellar masses in the dashed line. The red dashed line is the predicted MZR at z = 5 − 12 from FIRE-2 simulation (Marszewski et al. 2024).
Current usage metrics show cumulative count of Article Views (full-text article views including HTML views, PDF and ePub downloads, according to the available data) and Abstracts Views on Vision4Press platform.
Data correspond to usage on the plateform after 2015. The current usage metrics is available 48-96 hours after online publication and is updated daily on week days.
Initial download of the metrics may take a while.