Fig. 19.
Download original image
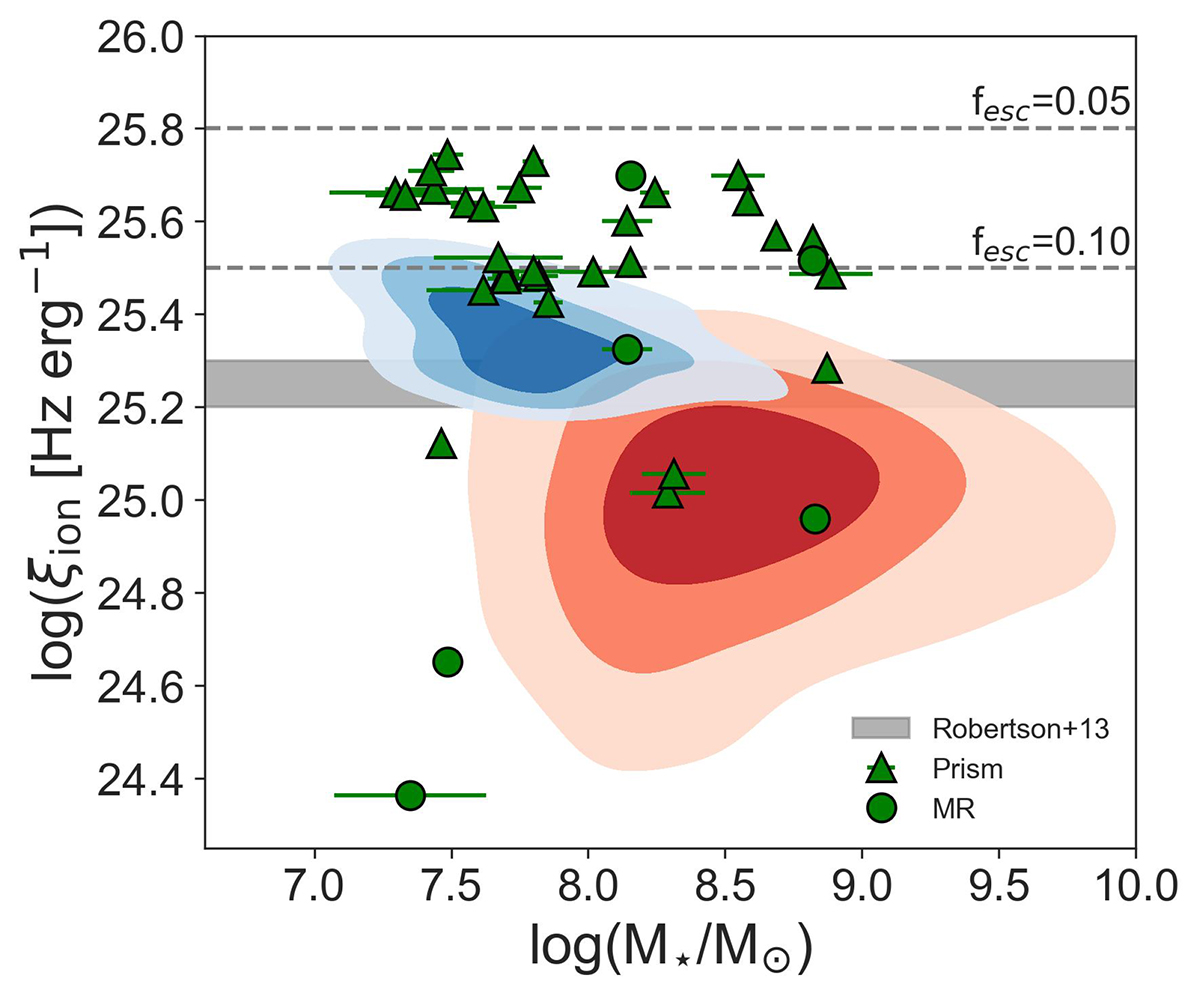
Relation between stellar mass and ξion for the sample of EELGs and control sample (same as in Fig. 16). The gray shaded region is the canonical ξion value given by a simple stellar population at constant SFR over 100 Myr (Robertson et al. 2013), assuming an escape fraction of 0.20. The horizontal dashed lines are the canonical ξion values for an escape fraction of 0.10 and 0.05, respectively.
Current usage metrics show cumulative count of Article Views (full-text article views including HTML views, PDF and ePub downloads, according to the available data) and Abstracts Views on Vision4Press platform.
Data correspond to usage on the plateform after 2015. The current usage metrics is available 48-96 hours after online publication and is updated daily on week days.
Initial download of the metrics may take a while.