Fig. 18.
Download original image
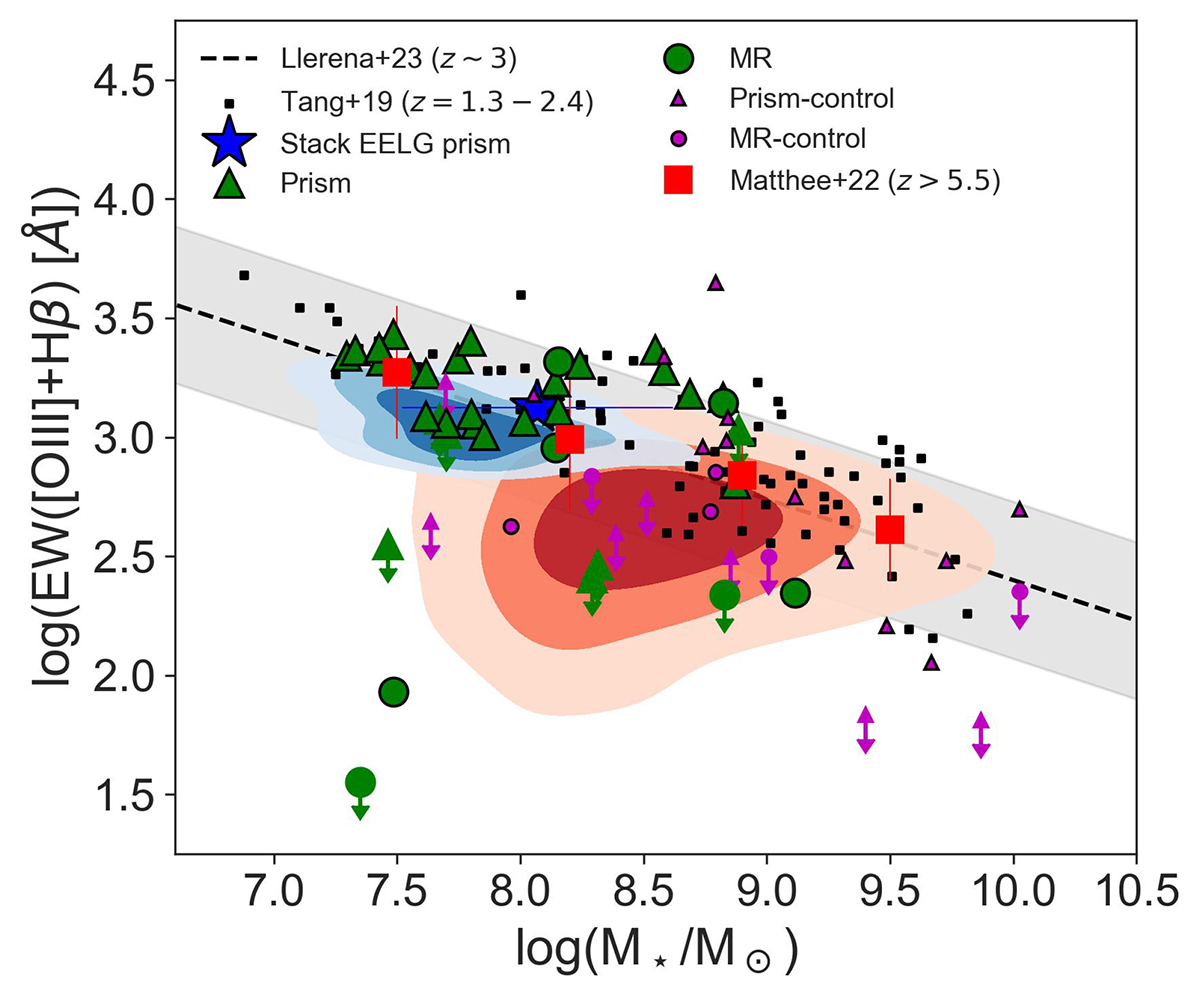
Relation between stellar mass and EW([OIII]+Hβ). The contours are the same as in Fig. 16. In green symbols, the subsample of EELG candidates with NIRSpec spectroscopy, while the control sample is in magenta symbols. The blue star is the stack of the EELGs with prism spectra. The black dashed line is the relation at z ∼ 3 and the observed scatter (Llerena et al. 2023). The red squares are stacks of z > 5.5 galaxies (Matthee et al. 2023).
Current usage metrics show cumulative count of Article Views (full-text article views including HTML views, PDF and ePub downloads, according to the available data) and Abstracts Views on Vision4Press platform.
Data correspond to usage on the plateform after 2015. The current usage metrics is available 48-96 hours after online publication and is updated daily on week days.
Initial download of the metrics may take a while.