Open Access
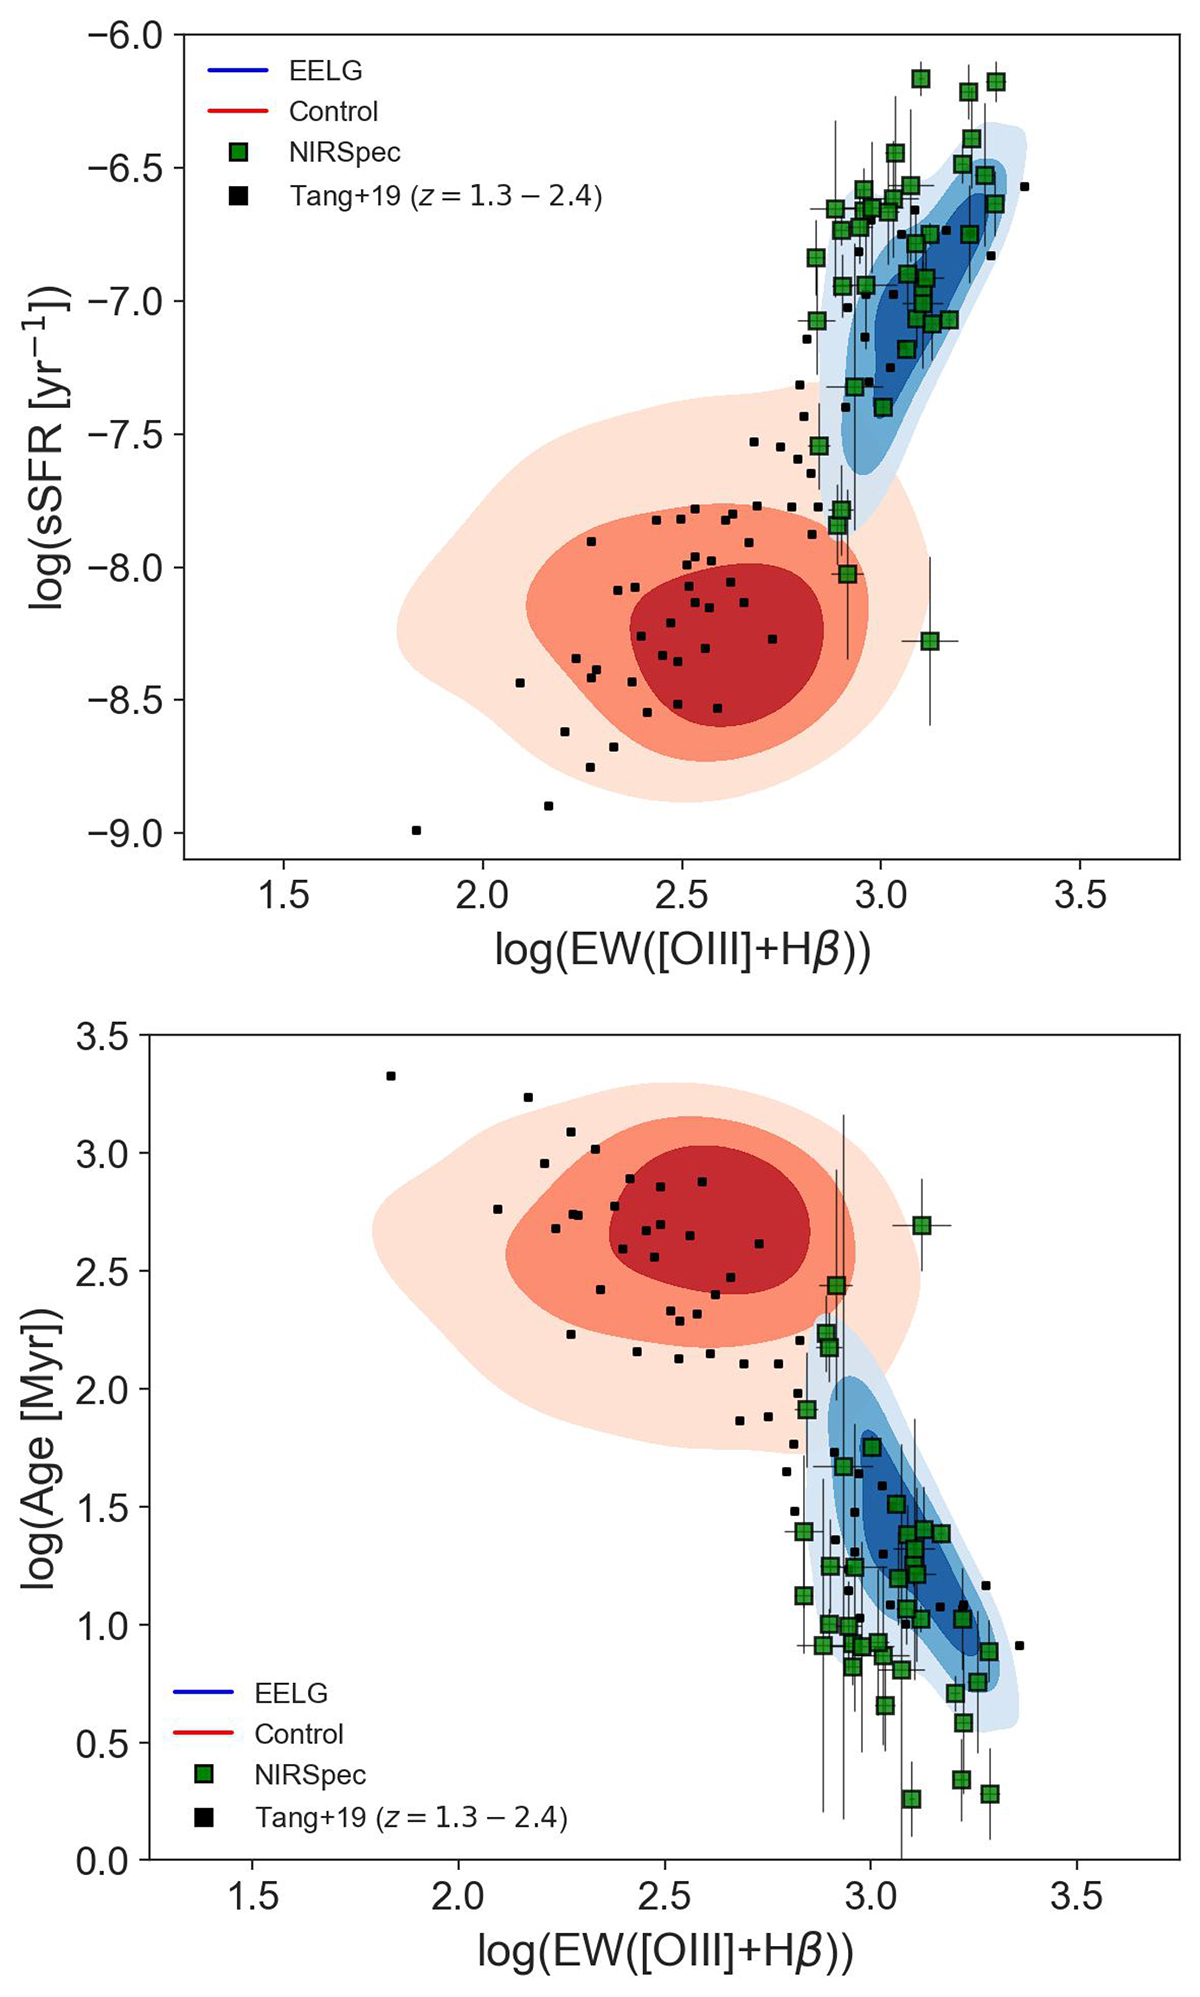
Fig. 17.
Download original image
Relation between EW([OIII]+Hβ) and sSFR (top panel) and age (bottom panel) for the sample of EELGs and control sample (same as in Fig. 16). The black squares are a sample of EELGs at z = 1.3 − 2.4 (Tang et al. 2019). The EWs of the sample with NIRSpec spectra are from photometry measurements.
Current usage metrics show cumulative count of Article Views (full-text article views including HTML views, PDF and ePub downloads, according to the available data) and Abstracts Views on Vision4Press platform.
Data correspond to usage on the plateform after 2015. The current usage metrics is available 48-96 hours after online publication and is updated daily on week days.
Initial download of the metrics may take a while.