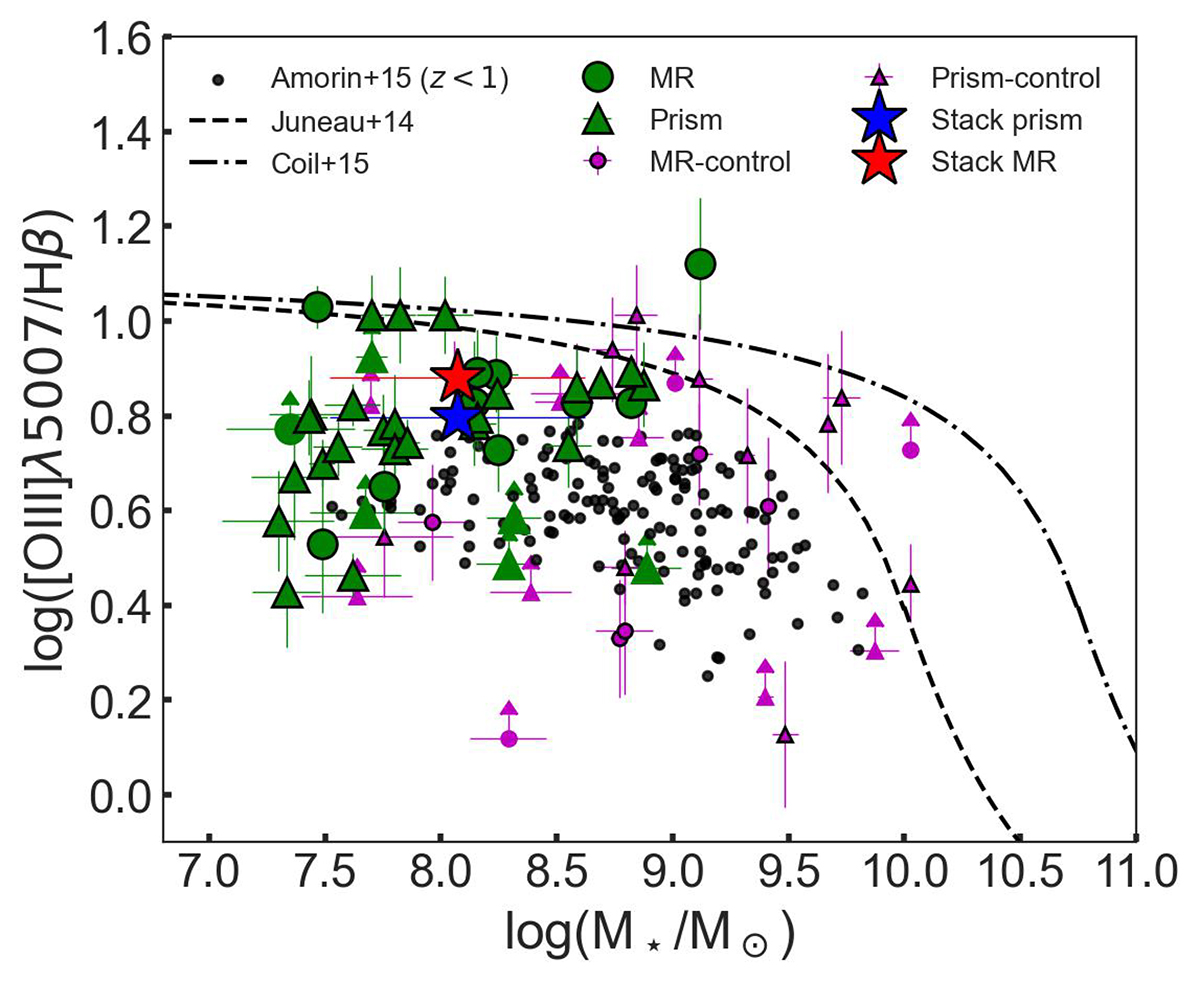
Fig. 15.
Download original image
Mass-Excitation (MEx) Diagram. The EELG candidates with NIRSpec spectra are in green symbols (circles for medium-resolution (MR) and triangles for prism). The stacks in this work are marked by star symbols. Galaxies in the control sample with NIRSpec spectra are shown with magenta circles (medium-resolution mode) and triangles (prism mode) symbols. The black dashed line indicates the demarcation between star-forming galaxies and AGN, according to Juneau et al. (2014). The black dashed-dotted line is the demarcation at z ∼ 2 (Coil et al. 2015). The black circles are EELGs up to z ∼ 1 (Amorín et al. 2015).
Current usage metrics show cumulative count of Article Views (full-text article views including HTML views, PDF and ePub downloads, according to the available data) and Abstracts Views on Vision4Press platform.
Data correspond to usage on the plateform after 2015. The current usage metrics is available 48-96 hours after online publication and is updated daily on week days.
Initial download of the metrics may take a while.