Open Access
Fig. 11.
Download original image
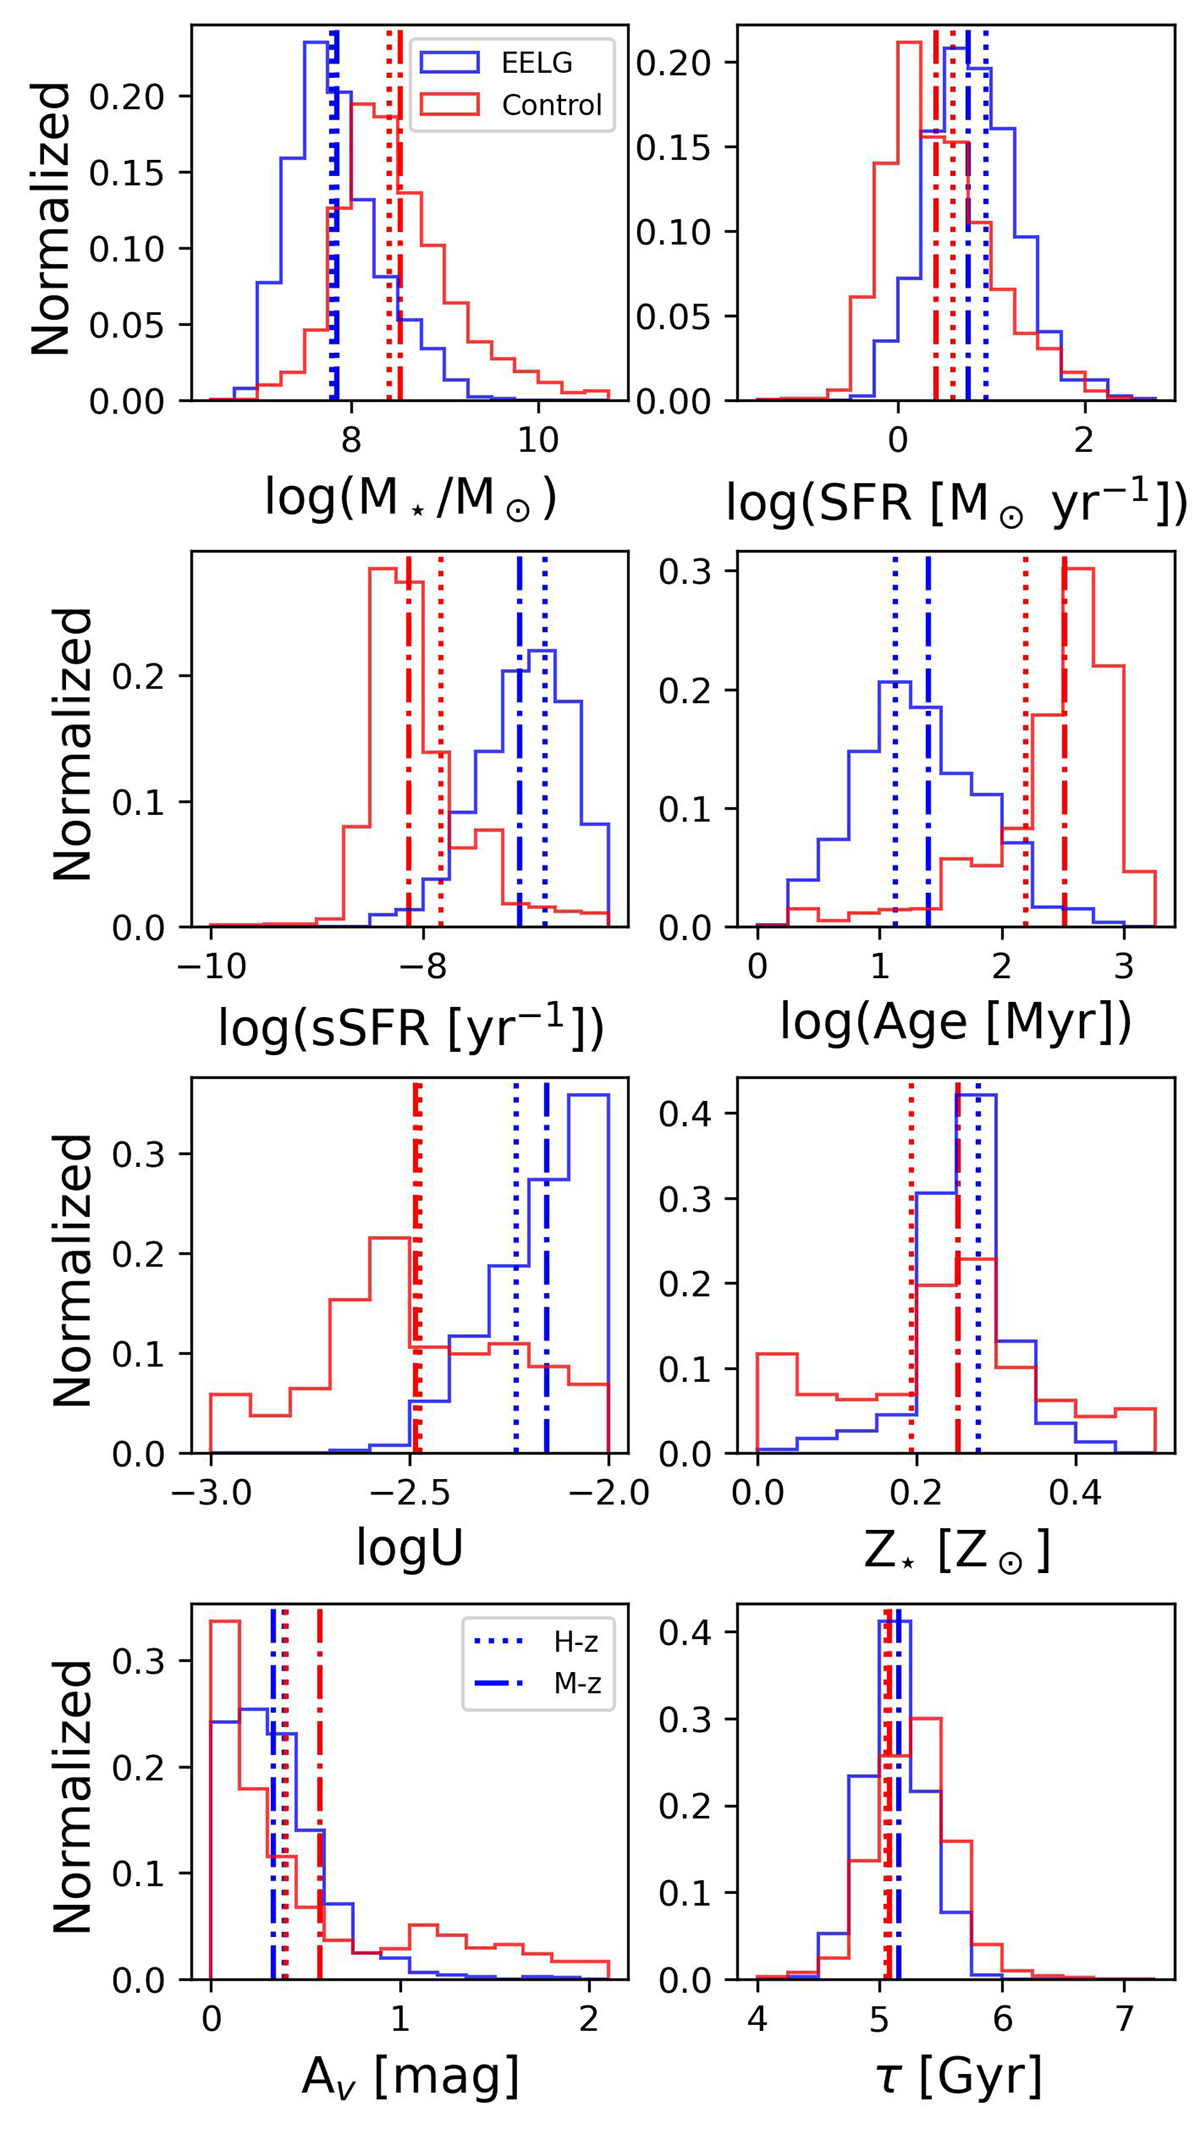
Distribution of the physical parameters based on the SED fitting for the sample of EELG candidates (in blue) and the control sample (in red). The vertical dotted (H−z sample) and dotted-dashed (M−z sample) lines are the mean values of each parameter.
Current usage metrics show cumulative count of Article Views (full-text article views including HTML views, PDF and ePub downloads, according to the available data) and Abstracts Views on Vision4Press platform.
Data correspond to usage on the plateform after 2015. The current usage metrics is available 48-96 hours after online publication and is updated daily on week days.
Initial download of the metrics may take a while.