Open Access
Fig. 10.
Download original image
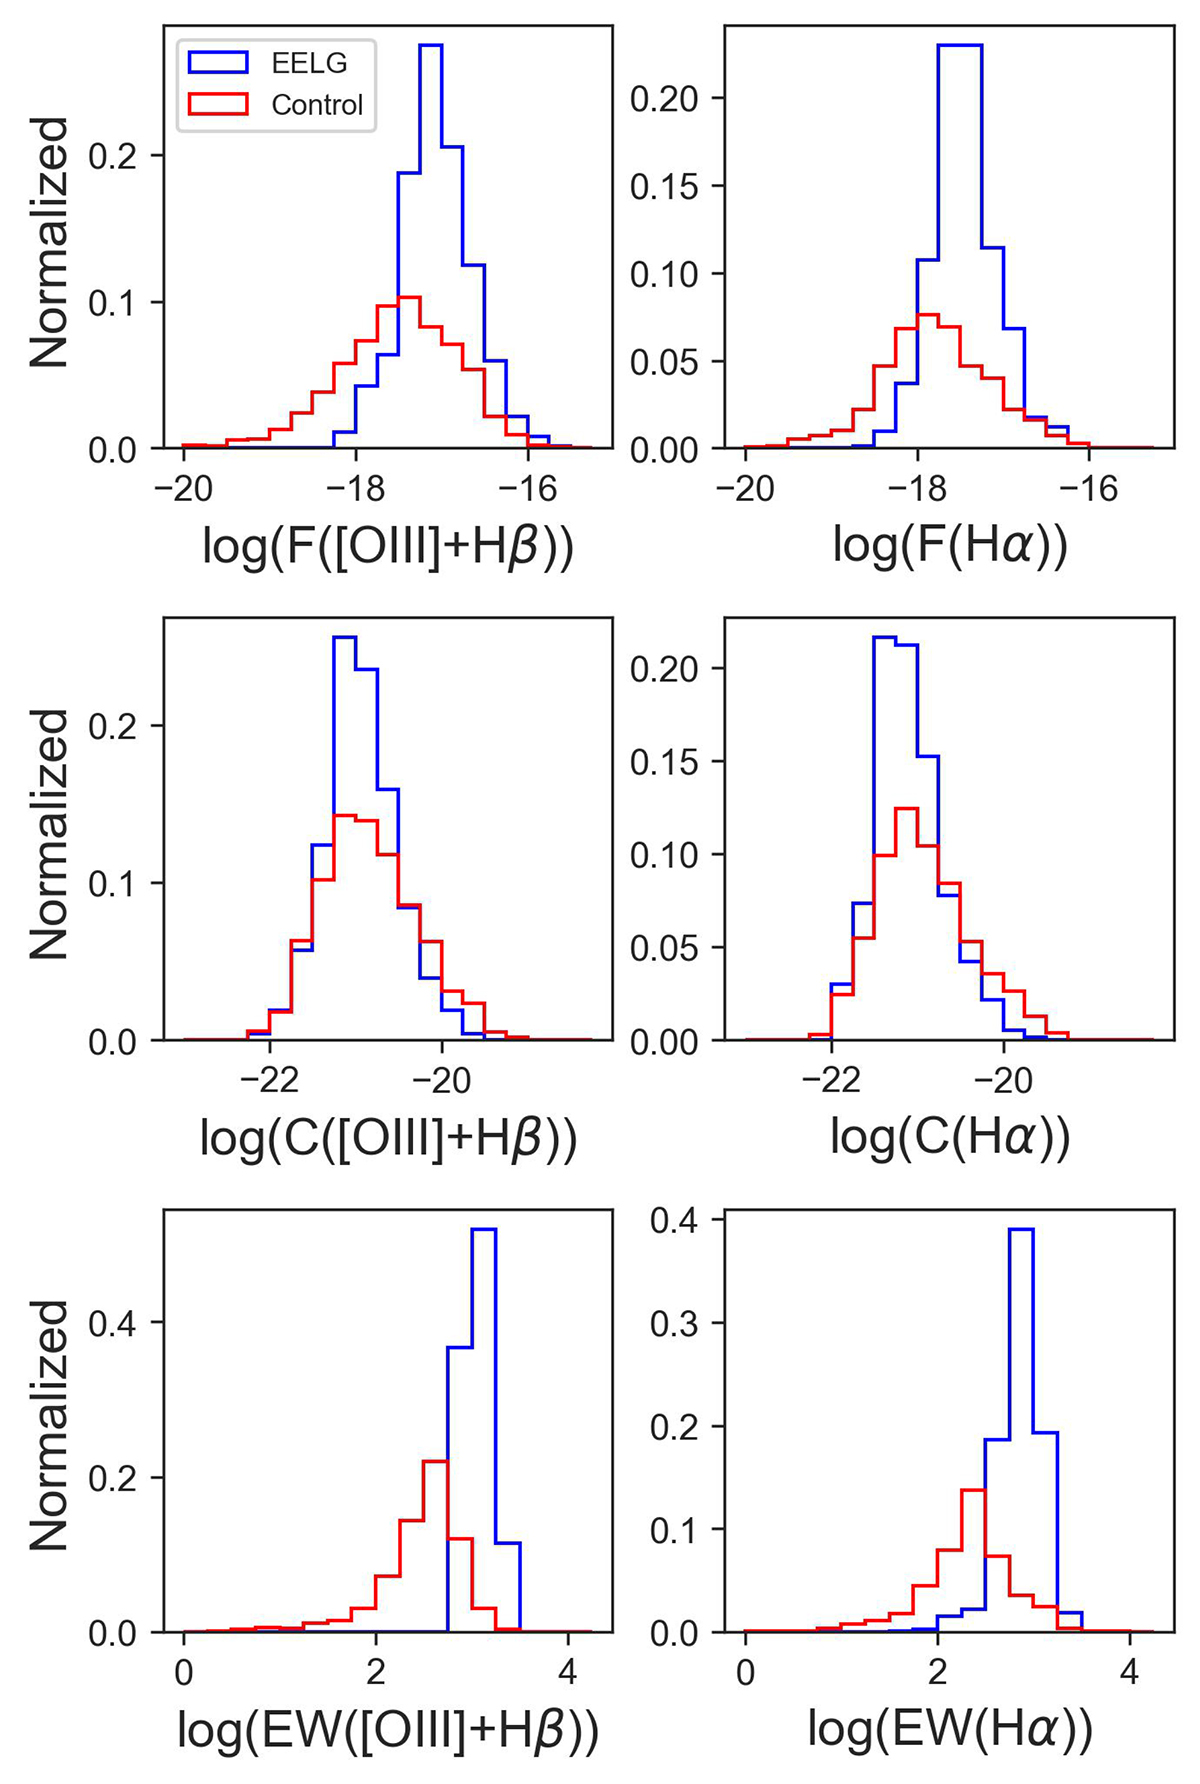
Photometric fluxes of [OIII]+Hβ (left panels) and Hα (right panels) for the sample of EELG candidates (in blue) and the control sample (in red). From top to bottom: Integrated flux of the line in units of erg s−1 cm−2, continuum in the line wavelength in units of erg s−1 cm−2 Å−1, and rest-frame EW in units of Å.
Current usage metrics show cumulative count of Article Views (full-text article views including HTML views, PDF and ePub downloads, according to the available data) and Abstracts Views on Vision4Press platform.
Data correspond to usage on the plateform after 2015. The current usage metrics is available 48-96 hours after online publication and is updated daily on week days.
Initial download of the metrics may take a while.