Fig. 7.
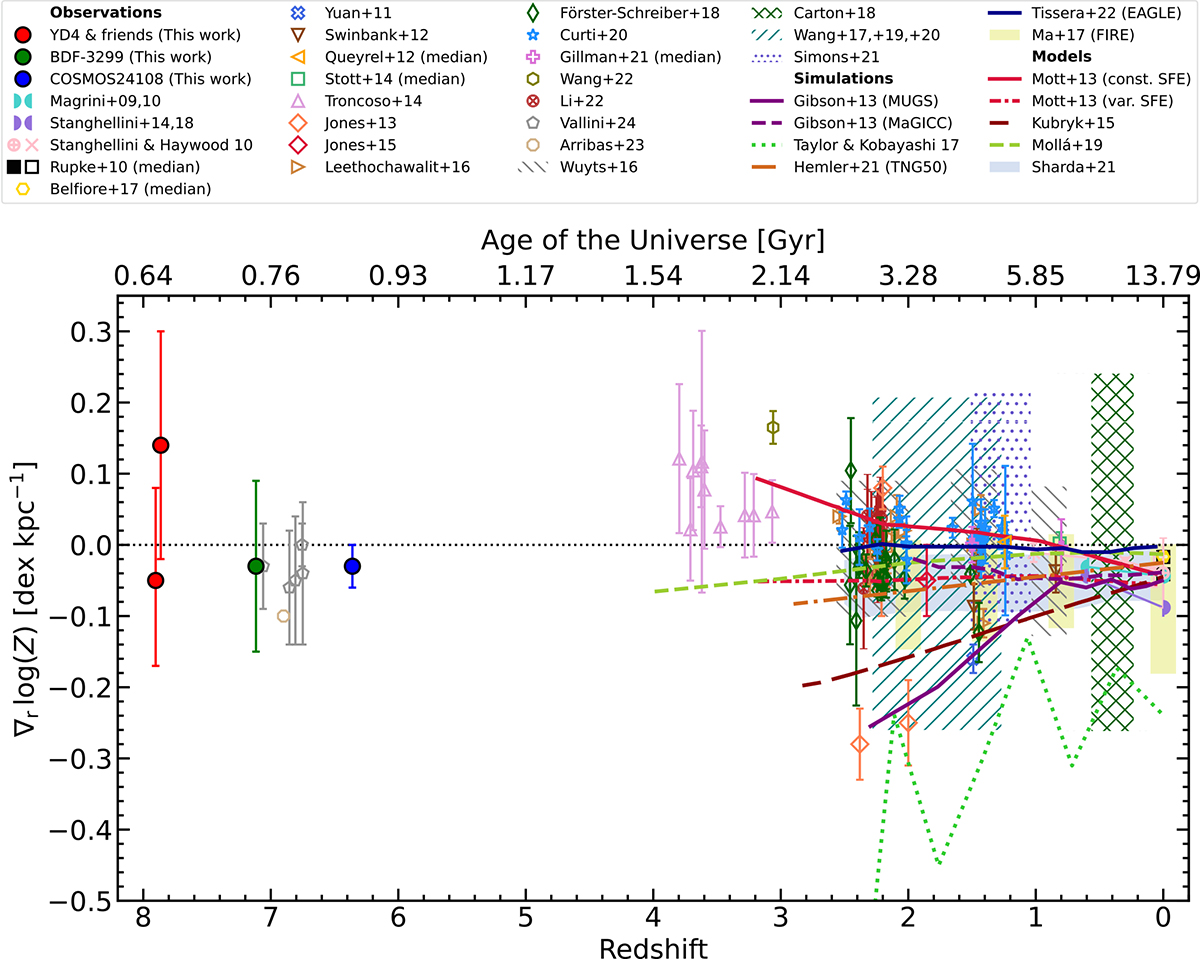
Download original image
Gas-phase metallicity gradient (in dex kpc−1) as a function of redshift (bottom x axis) and cosmic time (upper x axis). The targets analysed in this work are marked with red (A2744-YD4 and YD1), green (BDF-3299), and blue (COSMOS24108). The other symbols are a compilation of gas-phase metallicity gradients from literature. Specifically, at z ∼ 0, we report the measurements from Rupke et al. (2010c, full and empty squares for isolated and merging galaxies, respectively) and Belfiore et al. (2017, MaNGA, median). The evolution of metallicity gradients with cosmic time for the Milky Way, M33, and M81 from H II regions (z ∼ 0) and PNe (up to a few Gyr ago), from Magrini et al. (2009, 2010), Stanghellini & Haywood (2010, 2018), and Stanghellini et al. (2014) is shown. We report the gradients estimated at various z from Yuan et al. (2011), Swinbank et al. (2012, HiZELS), Queyrel et al. (2012, MASSIV, median), Stott et al. (2014, KMOS-HiZELS, median), Troncoso et al. (2014, AMAZE + LSD), Jones et al.; Jones et al. (2013; 2015, GLASS), Leethochawalit et al. (2016, CASSOWARY), Wuyts et al. (2016, KMOS3D), Carton et al. (2018), Wang et al. (2017, 2019, 2020, 2022, GLASS + GLASS JWST), Förster Schreiber et al. (2018, SINS/zC-SINF), Curti et al. (2020a, KLEVER), Gillman et al. (2021, KROSS + KGES, median), Simons et al. (2021, CLEAR), Li et al. (2022), MAMMOTH-Grism), Vallini et al. (2024), and Arribas et al. (2024, GA-NIFS). Hatched regions are reported in case of large samples. The predictions for the evolution of metallicity gradients from cosmological simulations are also shown, specifically for MUGS (enhanced feedback) and MaGICC (normal feedback) from Gibson et al. (2013), FIRE (Ma et al. 2017), Taylor & Kobayashi (2017), TNG50 (Hemler et al. 2021), and EAGLE (Tissera et al. 2022), together with the predicted evolution from the chemical evolution models from Mott et al. (2013, for both constant and variable SFE), Kubryk et al. (2015), Mollá et al. (2019), and Sharda et al. (2021).
Current usage metrics show cumulative count of Article Views (full-text article views including HTML views, PDF and ePub downloads, according to the available data) and Abstracts Views on Vision4Press platform.
Data correspond to usage on the plateform after 2015. The current usage metrics is available 48-96 hours after online publication and is updated daily on week days.
Initial download of the metrics may take a while.