Fig. 3.
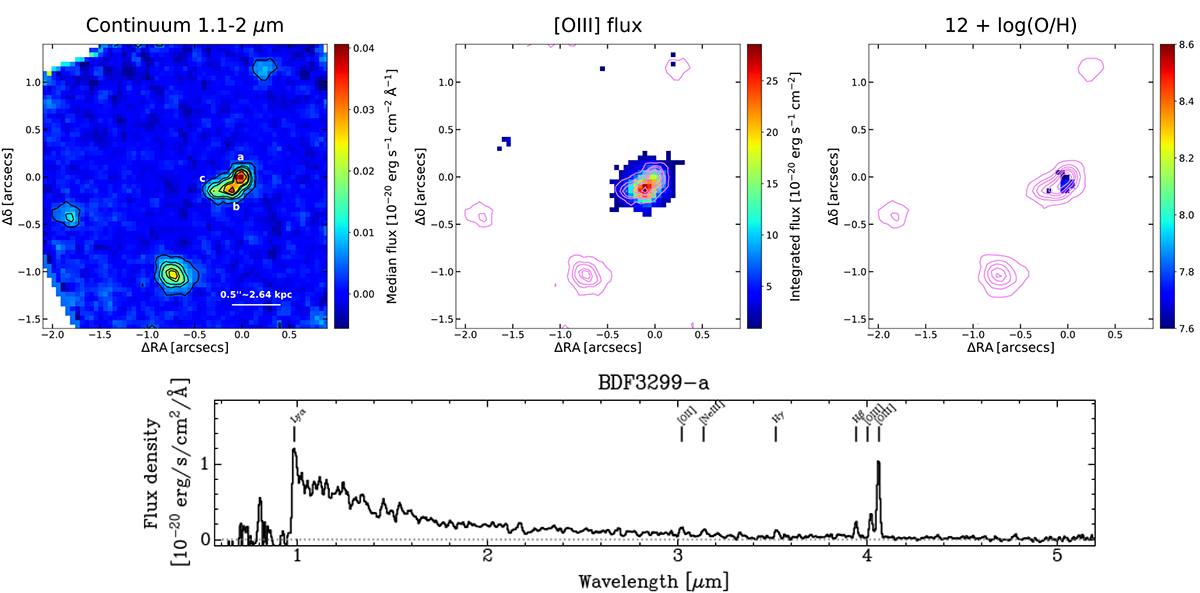
Download original image
Maps for BDF-3299 from JWST NIRSpec IFU. The flux maps are obtained from the original data cube, while the line ratio and metallicity maps from the spatially smoothed data cube (details in Sect. 2.2). Median stellar continuum emission in the observed spectral range 1.1–2 μm (∼0.14–0.25 μm rest-frame; top-left). The rest is as in Fig. 2. The PRISM/CLEAR spectrum (bottom) is extracted from a circular aperture with radius of 0.1″ centred at the location of the most luminous component in continuum, BDF-3299-a.
Current usage metrics show cumulative count of Article Views (full-text article views including HTML views, PDF and ePub downloads, according to the available data) and Abstracts Views on Vision4Press platform.
Data correspond to usage on the plateform after 2015. The current usage metrics is available 48-96 hours after online publication and is updated daily on week days.
Initial download of the metrics may take a while.