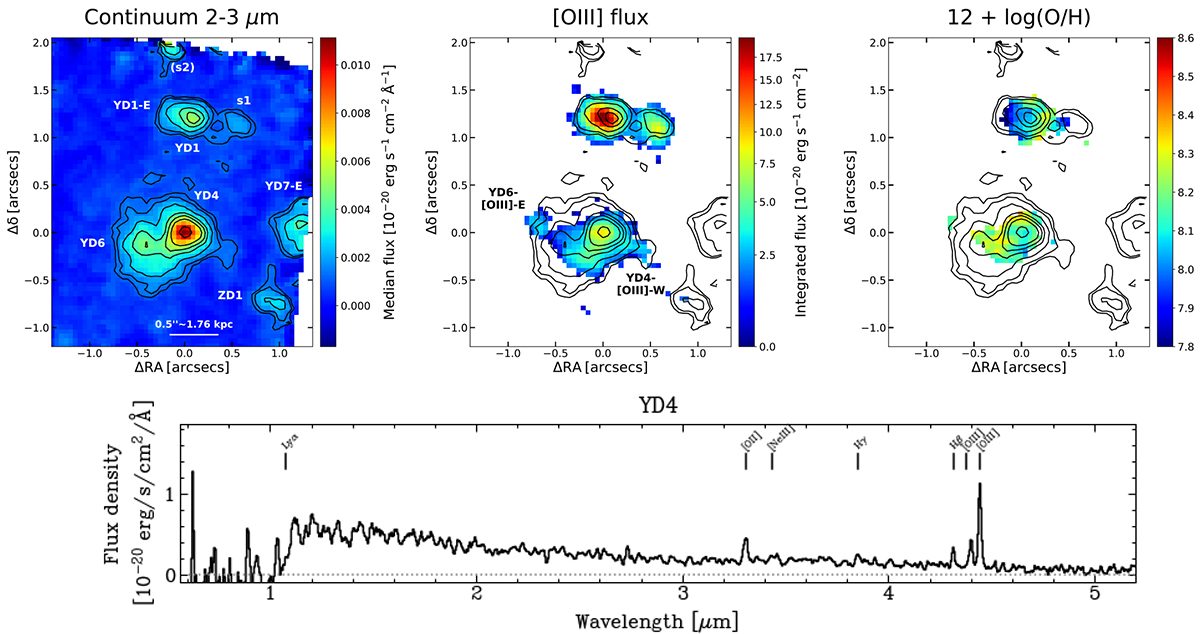
Fig. 2.
Download original image
Maps for A2744-YD4 from JWST NIRSpec IFU. All the maps are obtained from the (wavelength-dependent) spatially smoothed data cube (details in Sect. 2.2). No extinction correction is applied. A cut of S/N > 3 on the peak flux of each line is applied. Median stellar continuum emission in the observed spectral range 2–3 μm (0.23–0.34 μm rest-frame; left); [O III] integrated flux (centre); map of oxygen abundance, 12+log(O/H) (right). Contours mark the continuum from first panel. NIRSpec PRISM/CLEAR spectrum extracted from a circular aperture with radius of 0.15″ centred at the location of the target YD4 (bottom).
Current usage metrics show cumulative count of Article Views (full-text article views including HTML views, PDF and ePub downloads, according to the available data) and Abstracts Views on Vision4Press platform.
Data correspond to usage on the plateform after 2015. The current usage metrics is available 48-96 hours after online publication and is updated daily on week days.
Initial download of the metrics may take a while.