| Issue |
A&A
Volume 691, November 2024
|
|
|---|---|---|
| Article Number | A187 | |
| Number of page(s) | 16 | |
| Section | Astrophysical processes | |
| DOI | https://doi.org/10.1051/0004-6361/202449728 | |
| Published online | 13 November 2024 | |
Radiation mechanism of twin kilohertz quasi-periodic oscillations in neutron star low-mass X-ray binaries
1
School of Physics and Optoelectronic Engineering, Hainan University, Hainan 570228, China
2
Yunnan Observatory of Chinese Academy of Sciences, Kunming 650216, China
3
Key Laboratory of Particle Astrophysics, Institute of High Energy Physics, Chinese Academy of Sciences, Beijing 100049, China
4
School of Astronomy and Space Science, Nanjing University, Nanjing 210023, China
⋆ Corresponding author; This email address is being protected from spambots. You need JavaScript enabled to view it.
Received:
25
February
2024
Accepted:
27
July
2024
Abstract
Context. The connection between quasi-periodic oscillations (QPOs) and magnetic fields has been investigated in various celestial bodies. Magnetohydrodynamic (MHD) waves have been employed to explain the simultaneous upper and lower kilohertz (kHz) QPOs. Nevertheless, the intricate and undefined formation pathways of twin kHz QPOs present a compelling avenue for exploration. This study area holds great interest as it provides an opportunity for deriving crucial parameters related to compact stars.
Aims. We strive to develop a self-consistent model elucidating the radiation mechanism of twin kHz QPOs, which we then compare it with observations.
Methods. A sample of 28 twin kHz QPOs detected from the X-ray binary 4U 1636–53 was used for a comparison with the results of the Markov chain Monte Carlo calculations based on our model of the radiation mechanism of twin kHz QPOs, which is related to twin MHD waves.
Results. We obtained 28 groups of parameters of 4U 1636–53 and a tight exponential fit between the flux and the temperature of seed photons to Compton up-scattering and find that the electron temperature in the corona around the neutron star decreases with increasing seed photon temperature.
Conclusions. The origin of twin kHz QPOs are dual disturbances that arise from twin MHD waves that are generated at the innermost radius of an accretion disc. The seed photons can be transported through a high temperature corona and are Compton up-scattered. The photons that vary the frequencies of twin MHD waves lead to the observed twin kHz QPOs.
Key words: accretion / accretion disks / radiation: dynamics / scattering / stars: neutron
© The Authors 2024
 Open Access article, published by EDP Sciences, under the terms of the Creative Commons Attribution License (https://creativecommons.org/licenses/by/4.0), which permits unrestricted use, distribution, and reproduction in any medium, provided the original work is properly cited.
This article is published in open access under the Subscribe to Open model. This email address is being protected from spambots. You need JavaScript enabled to view it. to support open access publication.
1. Introduction
Quasi-periodic Oscillations (QPOs) have been identified in many types of celestial objects including the Sun, stars, magnetars, neutron star low-mass X-ray binaries (NS-LMXBs), black hole LMXBs and active galactic nuclei (van der Klis 2006; Nakariakov & Melnikov 2009; Shi et al. 2018). However, the fastest X-ray variability, known as kilohertz QPOs (kHz QPOs), in NS-LMXBs has received more attention because the high frequencies of QPOs might be related to some general relativity effects. Kilohertz QPOs often emerge in pairs in the power spectra of NS-LMXBs, which are called twin kHz QPOs, and upper and lower kHz QPOs according to their frequencies (fu and fl).
Initially, the difference in the frequencies between the twin kHz QPOs appeared to be relatively constant, which led to the proposal of the beat-frequency model (Miller et al. 1998). This and subsequent models, needed to explain why the difference in the twin kHz QPO frequencies is not a stochastic value and why they can emerge simultaneously. Furthermore, Barret et al. (2005) and Ribeiro et al. (2017) posited that the origin of the upper QPOs was likely different from that of the lower QPOs because some properties were different, including the fraction root mean square (hereafter rms) amplitude, the quality factors and the time lag between soft and hard X-ray photons. A comprehensive explanation should therefore account for both the relation between these phenomena and their distinguishing characteristics.
In LMXBs, the available models of QPOs are mainly divided into two categories: a dynamic mechanism, and a radiation origin. Generally, QPOs are thought to be produced in an accretion disc or on the surface of a corona, and numerous dynamic models have been proposed to account for their occurrence (e.g. Miller et al. 1998; Stella & Vietri 1999; Osherovich & Titarchuk 1999; Abramowicz et al. 2003; Shi & Li 2009, 2010; Shi 2010; Shi et al. 2014, 2018; Ingram & Done 2011).
In the context of radiation-based mechanisms, several key questions revolve around the specific locations in which QPOs are generated and how they are ultimately produced in X-ray emissions. This involves understanding the connection between the aforementioned dynamic models and the actual generation of X-rays. Berger et al. (1996) obtained a correlation between the rms of QPOs and the energy of photons in 4U 1608−52. Zhang et al. (1996) discovered 870 Hz QPOs with a high rms at high energies and suggested that the QPOs might originate either at the NS surface or very close to the NS because the temperature of the emission region of QPOs was higher than that of the accretion disc. Gilfanov et al. (2003) analysed the variability of GX 340+0 and 4U 1608−52 and found that the rms spectrum of the QPOs was consistent with the Comptonised blackbody (BB) emission, which was assumed to originate from the boundary layer and not from the accretion disc. Titarchuk & Shaposhnikov (2005) discovered that the temperature of the spectral component from an NS was higher than that from the disc in LMXBs. Thus, a corona is often considered as the place from which both the hard X-ray photons and QPOs originate.
Zhang et al. (2017) confirmed that the lower kHz QPOs only appeared during the transition from the hard to the soft state, whereas the upper kHz QPOs emerged in most of the states in NS-LMXBs. This indicates that QPOs may depend on the states of the system and the rms of QPOs changes in different states. Lee et al. (2001) suggested that the resonance between the sources of soft photons and the Comptonizing medium might lead to the lower QPOs, which was fitted to the rms and the phase-lag data of the kHz QPO with a frequency (830 Hz). An increasing QPO rms with the increasing photon energy and a possible saturation or decline were observed in several works (Berger et al. 1996; Yu et al. 1997; Gilfanov et al. 2003; Mukherjee & Bhattacharyya 2012). The relation between QPO rms and the Comptonizing process were also discussed (e.g. Lee & Miller 1998; Zdziarski et al. 2005). Then, the Kompaneets equation was calculated in order to understand the energy dependence of the rms and the time lag of the lower kHz QPOs (Kumar & Misra 2014; Karpouzas et al. 2020). However, a fundamental question that remains unanswered is the coupling of the simultaneous twin kHz QPOs with the X-ray radiation.
The variability in the Sun, which is similar to QPOs, is often called quasi-periodic pulsations (QPPs) and is often seen in different wave bands from the radio to hard X-rays. QPPs have been attributed to potential origins in magnetohydrodynamic (MHD) oscillations, which may arise from standing modes within plasma structures or from wave dispersion (Nakariakov & Melnikov 2009). Nakariakov et al. (2004) suggested that fast and slow magnetoacoustic modes of a coronal loop might be the origin of QPPs in the Sun. The mechanism of QPOs in an NS-LMXB may be similar to that in the Sun, that is to say, QPOs may also be related to magnetohydrodynamics. However, it is essential to note that significant disparities exist in the gravitational forces and magnetic fields between the Sun and compact stars, and the different values of gravity and a magnetic field may therefore lead to the difference in the quasi-periods for QPPs in the Sun and QPOs in XBs.
Méndez (2006) suggested that the frequencies of kHz QPOs might be determined at the accretion disc and that their features might be modulated at the high-energy spectral component (e.g. corona or boundary layer). A series of our previous works was made on the relation between the frequencies of kHz QPOs and the accretion disc in LMXBs. Shi & Li (2009, 2010) first considered that the MHD waves were the origin of high-frequency QPOs in NS-LMXBs and BH-LMXBs. Then, the relation between the accretion rate and the frequencies of kHz QPOs was obtained by twin MHD waves (Shi et al. 2014, 2018). In order to explain the rms of twin kHz QPOs and to combine the dynamic mechanism with the radiation process, we need to explore the physical process that produces twin MHD waves at the innermost radius of an accretion disc and how they are transported into the corona around an NS along with magnetic field lines (Shi & Li 2009; Shi et al. 2014, 2018).
In order to answer the above fundamental question, we combined the connection and the difference between upper and lower kHz QPOs, that is to say, we assumed that QPOs can be produced in the same dynamic mechanism, but that the twin QPO signals originate from different regions of the corona around the NS in the XB. The MHD waves interact with the plasma in the corona and lead to some oscillations (e.g. the heating rates, the electron temperature, and the number density of photons) based on quasi-steady X-ray emission described by the Kompaneets equation. Finally, the oscillations of the number density of emission photons lead to the X-ray variabilities in a power spectrum. In this work, the basic physics for generating twin kHz QPOs in a corona and the basic equations for describing twin kHz QPOs, including the Kompaneets equation, are introduced in Sect. 2. In Sect. 3 we revisit the observational data from Zhang et al. (2017) in order to compare them with our calculation with a Monte Carlo method. The rms of 28 groups of twin kHz QPOs in 4U 1636−53 is also obtained. Our discussion and conclusions about twin kHz QPOs are presented in the last section.
2. Twin kilohertz quasi-periodic oscillations produced in a corona
Shi & Li (2009, 2010), and Shi et al. (2014, 2018) have unveiled the presence of two distinct modes in MHD waves, offering an explanation for the concurrent upper and lower kHz QPOs. Similar to the twin kHz QPOs, the twin MHD waves are called upper and lower MHD waves according to their frequencies. Originating within the innermost regions of the accretion disc in an LMXB, these MHD waves propagate into the corona that envelops the NS within the LMXB (see Fig. 1). As shown in Somov (2012), upper MHD waves with higher frequencies can be transported a shorter distance than lower MHD waves (e.g. for slightly damped MHD waves and Landau damping). To comprehend the intricate process underlying the generation of variability, we developed a radiation model wherein the longer wavelength mode permeates the NS surface entirely, while the shorter wavelength mode solely perturbs the outer layers, that is to say, the upper kHz QPOs emanate from the outermost layer of the corona, whereas the lower QPOs arise from the entire corona. Finally, the radiation from Compton up-scattering is changed in the form of a quasi-periodic variability due to oscillations from the MHD waves. Consequently, the QPOs are thought to originate from the oscillating physical parameters of the plasma throughout the entire corona or from a specific segment of the corona influenced by disturbances from various physical processes associated with X-ray radiation in a quasi-steady state, which is the same as the steady radiation described by Kumar & Misra (2014) and Karpouzas et al. (2020).
A quasi-steady state is introduced here because it is challenging to maintain an absolute steady state. The variability of the mass accretion rate can affect the properties of the surface region of the corona. However, the quasi-steady state of the radiation field expands to most of the corona and is similar to the quasi-statics in the thermodynamics. This quasi-steady state can be maintained because the accumulation of accreting matter takes time and the macro parameters of the accretion system hardly change in a time longer than milliseconds (the timescale of kHz QPOs). For consistency with the terminology used by Kumar & Misra (2014) and Karpouzas et al. (2020), we refer to this quasi-steady state simply as the steady state below.
In principle, these perturbations can be generated by other mechanisms, but the twin MHD waves are an attractive candidate as we have already shown that they generate roughly the correct frequencies (Shi & Li 2009; Shi et al. 2014, 2018). In addition, the twin MHD waves offer an explanatory framework for the production of the two modes of twin kHz QPOs in different parts of the corona.
We assumed that the canonical NS in an LMXB (the NS mass M = 1.4 M⊙ and the NS radius R = 10 km) is surrounded by a uniform and isotropic spherical corona. We then explore this model with the perturbed Kompaneets equation for two layers of a corona below.
2.1. Compton up-scattering in the two layers of a corona
We assumed that a uniform spherical Comptonization corona with a depth L, an electron temperature Te, and an electron density ne surround a cold NS as a spherical blackbody, which can release seed photons. The injecting rate per unit volume is
 (1)
(1)
where Tb is the temperature of BB radiation and the expression is appropriate for the whole corona (Kumar & Misra 2014; Karpouzas et al. 2020).
Considering that the upper MHD waves are transported only in the outmost layer near the surface of the corona, we divided the corona into two layers with depths L1, L2, and the volumes V1, V2 respectively, where the subscripts 1 and 2 represent the first and second layers, respectively, throughout this work (Fig. 1). Then the whole optical depth of the corona can be expressed as  , where σT is the Thomson-scattering cross section.
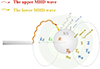 |
Fig. 1. Sketch of the process that generates twin MHD waves at the innermost radius of the accretion disc in an LMXB, which transports the waves along the magnetic field lines and radiates X-ray photons from the surface of the corona. The temperature and density are the same in the whole corona in steady radiation. The magnetic field lines are marked by the dotted black curves. |
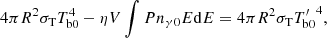
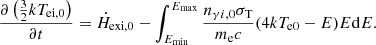
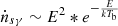
The Comptonization, in which the low-energy photons (E ≪ mec2) are scattered into low-energy electrons (kTe ≪ mec2), can be described by the Kompaneets equation (Kompaneets 1957). The updated form was presented by Psaltis & Lamb (1997) , and is expressed as follows:
![Mathematical equation: $$ \begin{aligned} \begin{aligned} t_c\frac{\partial n_{\gamma }}{{\partial }t}&=\frac{1}{{m_{\rm e}}c^2}\frac{{\partial }}{{\partial }E}\left[kT_{\rm e}\frac{{\partial }}{{\partial }E}\left(E^2n_{\gamma }\right)-4kT_{\rm e}En_{\gamma }+E^2n_{\gamma }\right]\\&\quad +t_c{\dot{n}}_{\mathrm{s}\gamma }-t_c\frac{c}{L}\frac{n_{\gamma }}{\left(1+\frac{1}{3}{\tau }_{\rm KN}\varepsilon \right)}, \end{aligned} \end{aligned} $$](/articles/aa/full_html/2024/11/aa49728-24/aa49728-24-eq3.gif) (2)
(2)
where me is the electron mass, c is the light speed, k is the Boltzmann constant, E is the energy of photons, t is time, tc = L/cτT is the Thomson collision timescale, nγ is the photon number density per unit energy interval, τKN
 is the optical depth for Klein-Nishina cross section σKN, and the parameter ε depends on E (see Appendix A). For simplicity, τKN is written τ and σKN is written σ below. Then τ, τ1, and τ2 are the whole optical depth and the local depth in the first and second layers with a Klein-Nishina cross section σ, σ1, and σ2, respectively.
Similar to Karpouzas et al. (2020), the probability per unit time for a photon escaping from the plasma with the depth (L) can be expressed as  , and that corresponding to the depth (Li) is
 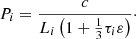 Thus, the number of photons escaping from an unit volume per unit time can be described by the expression Pnγ (or Pinγi). In addition, the reciprocal of the probability means the average time for a photon to escape from the medium.
2.2. Equations for the steady radiation and for the variabilities produced by magnetohydrodynamic waves
The twin kHz QPOs are produced by the oscillations from the disturbances of the MHD waves that are superposed on a steady X-ray radiation. After the MHD waves are transported into the corona, they change the heating rates because the MHD waves can heat the plasma in the corona and thus produce oscillations. The change in heating rate changes the electron temperature and other parameters. These disturbed parameters then change the final X-ray radiation, and twin kHz QPOs appear. We introduce below the result after the disturbances in the steady state.
2.2.1. Lower kilohertz quasi-periodic oscillations originate from the disturbance in the entire corona
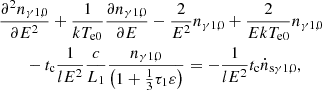
The lower kHz QPOs are thought to be generated by a disturbance of the entire corona in a steady state. Steady radiation is not related with time, that is,  , where the subscript 0 denotes the steady state. Thus, the Kompaneets equation (Eq. (2)) in steady state in the entire corona can be simplified as
 (3)
(3)
where  , and Eqs. (3)–(6) can be obtained from Karpouzas et al. (2020).
For an electron system, the change rate of its temperature should be attributed to the competition between the heating rate and the cooling rate, which can be expressed as
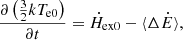 (4)
(4)
where  is the external heating rate per electron, and
  is the Compton cooling rate per electron, which can be expressed as
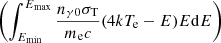
 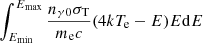 , and the limits (Emin, Emax) are assumed to be 2 keV and 60 keV, which are the same as in Kumar & Misra (2014) and Karpouzas et al. (2020). In steady state, the temperature of the electron system remains unchanged
  . The heating rate is then obtained as
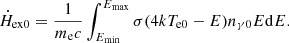 (5)
(5)
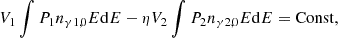
Some photons impinge back onto the seed photons sources with the feedback coefficient (η), and the energy of these photons is ηV∫Pnγ0EdE. Then, the steady radiation in the border between the NS and the entire corona can be obtained as
 (6)
(6)
where  is the energy generation rate inside the seed photon source and it is nearly unchanged (Kumar & Misra 2014; Karpouzas et al. 2020).
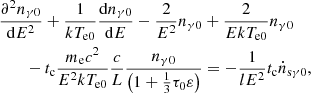
After the disturbance from the lower MHD wave, some variables can be expressed as Tel = Te0(1 + ΔTe0e−iω1t), Tbl = Tb0(1 + ΔTb0e−iω1t), nγl = nγ0(1 + Δnγ0e−iω1t),  , where ω1 = 2πfl, Tel, nγl, and
  are the electron temperature, electron density, the temperature of the seed photons, and the heating rate after the disturbance. Combing Equations (3), (4), and (6), we obtained the equations for the disturbance,
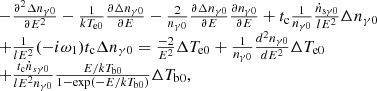 (7)
(7)
 (8)
(8)
![Mathematical equation: $$ \begin{aligned}&\begin{aligned}&\Delta T_{\rm e0}=\left({\dot{H}}_{\rm ex0}{\Delta {\dot{H}}_{\rm exl}}-\frac{ kT_{\rm e0}}{m_{\rm e}c} \int _{E_{\rm min}}^{E_{\rm max}}{\sigma }{4n_{\gamma 0}\Delta n_{\gamma 0}}E\mathrm{d}E\right.\\&\quad \qquad \left.+\frac{1}{m_{\rm e}c}\int _{E_{\rm min}}^{E_{\rm max}}{{\sigma }_{\rm }n}_{\gamma 0}{\Delta n_{\gamma 0}}E^2\mathrm{d}E\right)\\&\quad \qquad \Bigg /\left[\left(-i{\omega }_1\right){\frac{3}{2}}kT_{\mathrm{e}0}+4\frac{kT_{\rm e0}}{m_{\rm e}c}\int _{E_{\rm min}}^{E_{\rm max}} {\sigma }{n_{\gamma 0}}E\mathrm{d}E\right]. \end{aligned} \end{aligned} $$](/articles/aa/full_html/2024/11/aa49728-24/aa49728-24-eq22.gif) (9)
(9)
2.2.2. Upper kilohertz quasi-periodic oscillations originating from the perturbation in the outermost layer of a corona
The upper MHD waves only interact with the plasma in the second layer of the corona after the waves are transported into the corona. The corona is therefore considered to be divided into two layers. Because the steady state for the corona is stationary, the seed photon number input in the corona should be same, regardless of whether the corona is layered. In Sect. 2.2.1, seed photons were injected into the medium with a rate ( ), which was averaged in the entire corona in the same way as previously (Kumar & Misra 2014; Karpouzas et al. 2020). When the corona is layered, the seed photons are injected into the first layer with an injection rate
 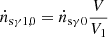 .
.
Similar to Equation (3), the Kompaneets equation in the two layers in the steady state can be simplified as
 (10)
(10)
and
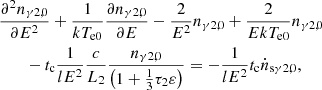 (11)
(11)
where 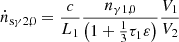 is the density of the input seed photons in the second layer per unit time, which comes from the output photons in the first layer. The energy change rate per electron in each layer of the corona can be expressed as
 (12)
(12)
Similar to Equation (5), the energy that is released and collected in each layer is also balanced, that is,  , and the heating rate in the two layers is therefore expressed as
 (13)
(13)
Because the entire corona and every part are in steady state, radiation from every boundary should be kept unchanged and the equation from the steady radiation in the boundary between the two layers is
 (14)
(14)
where V1∫P1nγ1, 0EdE is the outward radiation energy from the first layer, and ηV2∫P2nγ2, 0EdE is the photon energy that is bounced back from the second layer.
After the disturbance, the variables can be expressed as Teu = Te0(1 + ΔTeue−iω2t),  ,
,  , where ω2 = 2πfu. Similar to the change in Tb from
  after being disturbed by the lower wave,
  is also expected to be changed by the upper wave. The change arises from the disturbance of the effective density of seed photons in the second layer nγus = nγ1, 0(1 + Δnγuse−iω2t), which shows the interaction of the upper wave with the seed photons entering the second layer (
 ).
).
The change in photon density in the second layer can then be obtained from Equation (11) and is expressed as
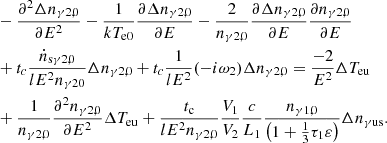 (15)
(15)
According to Equations (12) and (14), the changes in the electron temperature and the change in the density of the seed photons in the second layer are
![Mathematical equation: $$ \begin{aligned} \begin{aligned} \Delta T_{\rm eu}&=\left({\dot{H}}_{\mathrm{ex}2,0}{\Delta {\dot{H}}_{\rm exu}}-4lc{\sigma }_T\int _{E_{\min }}^{E_{\max }}n_{\gamma 2,0}{\Delta n_{\gamma 2,0}}E\mathrm{d}E\right.\\&\qquad \left.+\frac{{\sigma }_{\rm T}}{m_ec}\int _{E_{\min }}^{E_{\max }}n_{\gamma 2,0}{\Delta n_{\gamma 2,0}}E^2\mathrm{d}E\right)\\&\qquad \Bigg /\left[\frac{3}{2} kT_{\mathrm{e}0}\left(-i{\omega }_2\right)+4lc{\sigma }_T\int _{E_{\min }}^{E_{\max }}n_{\gamma 2,0}E\mathrm{d}E\right], \end{aligned} \end{aligned} $$](/articles/aa/full_html/2024/11/aa49728-24/aa49728-24-eq38.gif) (16)
(16)
and
 (17)
(17)
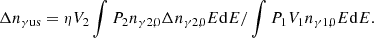
Combining Equations (3), (10), and (11), we calculated the density of the diffusion photons (nγ0, nγ1, 0, nγ2, 0). Then, we obtained the disturbed density of photons (Δnγ0) from Equations (7), (8), and (9) and Δnγ2, 0 from Equations (15), (16), and (17). The parameters nγ0, nγ1, 0, nγ2, 0, Δnγ0, and Δnγ2, 0 determine the rms of twin kHz QPOs, which can be expressed as RMSL = ∫nγ0Δnγ0dE/∫nγ0dE for the lower QPOs and RMSU = ∫nγ2, 0Δnγ2, 0dE/∫nγ2, 0dE for the upper QPOs (also see Kumar & Misra 2014; Karpouzas et al. 2020). The expressions of the rms of twin kHz QPOs clearly show that QPOs depend on the states of sources, which can be used to study the properties of sources.
3. Key physical variables obtained with the Monte Carlo method
3.1. Basic parameters to match the observation
In order to compare with observations, we revisited the observational data of the twin kHz QPOs in 4U 1636−53 obtained by Zhang et al. (2017), in which the energy spectra in the energy interval (2 ∼ 60 keV) were used to determine the state parameters of the LMXB. The calculated energy spectrum with the expression 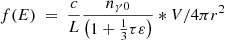 (in units of photons s−1 keV−1 cm2) was compared to the observed spectra, where r is the distance from 4U 1636−53 to the Earth, estimated as 6.0 ± 0.5 kpc by Galloway et al. (2006). According to the energy spectrum, the flux can be obtained by the expression, ∫260f(E)EdE. In addition, the fitted models for rms of kHz QPOs in Ribeiro et al. (2017)(
![Mathematical equation: $ \mathrm{RMSL} = 8.32(\pm0.05)*e^{-\frac{[f_{\mathrm{l}}-755.9(\pm1.5)]^2}{2*[150.74(\pm 2.12)]^2}} $](/articles/aa/full_html/2024/11/aa49728-24/aa49728-24-eq41.gif) ;
; ![Mathematical equation: $ \mathrm{RMSU} = 20(\pm 1)-0.0148(\pm0.0008) f_{\mathrm{u}}+3.2(\pm0.3)*e^{-\frac{[f_{\mathrm{u}}-799(\pm11)]^2}{2*[97(\pm13)]^2}} $](/articles/aa/full_html/2024/11/aa49728-24/aa49728-24-eq42.gif) ) were used to obtain the rms of the 28 twin kHz QPOs.
) were used to obtain the rms of the 28 twin kHz QPOs.
Lin et al. (2007) summarised many models to fit the energy spectra of accreting NS-LMXBs and most models included a soft thermal component and a hard Comptonised component. In our model, the NS BB photons are Comptonised, and then most of the BB photons do not escape from the corona, which means that the component of the NS BB photons in the spectrum is weak. Zhang et al. (2017) fitted the spectrum of 4U 1636−53, and revealed that above 4 keV, both the accretion disc component and the directly observed BB component from the neutron star are much weaker than the Comptonised component. In our model, the disc component is again not Comptonised effectively due to the much smaller coverage of the corona to the disc. Therefore, it is reasonable to exclude the soft component in our fitting. However, this exclusion may cause our fitted results for the lower energy spectrum ( and around
  ) to deviate from the observations. This is discussed further in Sect. 4.2. We therefore chose to narrow our focus to specific observed parameters, including the frequencies, RMSL, RMSU, and the flux density from the spectra.
3.2. Five parameters obtained in steady state, and three parameters obtained in a disturbance
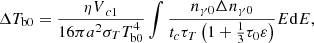
In order to compute the rms of QPOs, it is necessary to provide eight essential parameters that need to be input in the equations in Sect. 2: five system parameters (kTe, kTb, τ, L, and L2), one physical parameter (η), and two perturbation parameters ( , and
, and  ). In addition to these parameters, the frequencies of the observed twin kHz QPOs (fl, fu) should also be input in the equations in Sect. 2.
The analysis by Zhang et al. (2017) indicates that the lower kHz QPOs occur across a much broader range of optical depths compared to the upper kHz QPOs. Additionally, the range of optical depth values for the upper kHz QPOs falls within the wider range observed for the lower kHz QPOs. In other words, most of the optical depths associated with the lower QPOs are generally considerably higher than those linked to the upper QPOs. Statistically, this implies that individual lower QPOs may be indicative of a thick corona, while individual upper QPOs may correspond to a thin corona, assuming a slight change in electron density (ne), that is to say, the plasma layer from which the lower QPOs emerged is thicker than the layer from which the upper QPOs emerged. This is consistent with the result of the depths to which the twin MHD waves are transported in a corona. Consequently, we suggest that the lower QPOs originate from perturbations throughout the entire corona, while the upper kHz QPOs arise from disturbances in the outermost layer of the corona. Thus, the other parameters can be obtained from those eight parameters, including τ2 = L2τ/L, L1 = L − L2, and τ1 = τ − τ2.
The parameters in the steady states (kTe, kTb, τ, L) can be obtained with an MCMC fitting based on Eqs. (3)–(6) by matching the spectra (f(E)). The steady states can also approximately be described by multi-layers corona (Shi 2021), These parameters and L2 can therefore also be obtained with an MCMC fitting based on Eqs. (10)–(14).
The above five parameters can be fitted by the spectra in a steady state, but the sole values of  , and η in a disturbance cannot be obtained because the feedback factors (η) are unknown. Thus, the heating rate and a feedback factor (η ∈ (0, 1)) were estimated to align with the observational data, and their characteristic values were then calculated. First, the density of diffusion photons (nγ0, nγ1, 0, nγ2, 0) and the variables (Δnγ0, Δnγ2, 0) can be calculated with Equations (7)–(9) and (15)–(17) when
  , and η are chosen. Then RMSL and RMSU can be obtained according to all the parameters. Finally RMSL and RMSU of one twin kHz QPOs can be used to match the observation and to determine the value of the heating rate for a special η.
In summary, the acquisition of the eight parameters can be achieved through the following procedures:
-
The four parameters (kTe, kTb, τ, and L) were obtained with the MCMC method for the NS system in steady state. Specifically, a model energy spectrum was first generated with Eqs. (3)–(6) with the four parameters sampled in the four-dimensional parameter space, and they were then compared with the observed spectrum by minimising χ2. We used over 50 000 iterations for every one of the 28 observations with the twin kHz QPOs listed in Table B.1.
-
Similar to the above first fit, the depth of the second layer (L2) was obtained with the MCMC method according to Eqs. (10)–(14) in the above steady state. We used over 10 000 iterations after substituting the central values of kTe, kTb, τ, and L from the above fitting. The above five parameters can also be obtained with the MCMC method. However, due to the extensive computational effort required for an MCMC and the approximate nature of the results regarding the layering of a corona (as discussed in Shi 2021), we chose to focus on obtaining L2 after substituting the four parameters.
-
A feedback factor was chosen that changed from 0–1 in a step length 0.1, and we substituted the central values of kTe, kTb, τ, L, and L2 from the above steps 1 and 2. We then chose 3000 random heating rates in (0, 30), calculated RMSL and RMSU, and select those within the error limits of RMSL and RMSU.
-
We selected the feedback factor for the highest heating rate so that RMSL and RMSU lay within their error limits. We selected the twin heating rate with the chosen η by matching the central value of RMSL (or RMSU) as the characteristic value.
In the calculation method, Equations (3), (5), (11), (13), (7)–(9), and (15)–(17) needed to be rewritten into linear difference equations with some mathematical techniques (second-order accurate central differences formulas and Simpson rule) used by Karpouzas et al. (2020). The natural energy boundary conditions (nγ, nγi = 0 for Emin, Emax) were also applied to obtain the difference equations.
Finally, the five parameters fitted in a steady state and the three characteristic parameters in a disturbance are listed in Table B.1, which has similar values as the table of Karpouzas et al. (2020). However, it should be noted that the method for layering the corona in the two layers is an approximate one, and the effective depth of the outmost layer (L2) is the upper limit for which the above method for layering the corona in a steady state can be used to calculate RMSU. The real penetration depth of the upper MHD wave was determined by the specific interaction between the waves and the plasma. This needs to be explored in the future in MHD. The effective depth (L2) was therefore used to calculate the characteristic values of  , and η.
As described above, the change in the number density of photons from the heating rate can be obtained when the interaction between MHD waves and plasma is understood. With this information, the rms can be calculated, which enables a reproduction of the observed characteristics of the studied kHz QPOs. For example, the relation between rms and optical depth (τ), as depicted in Fig. 3 by Ribeiro et al. (2017), can be modelled accurately.
3.3. Our results for the Markov chain Monte Carlo fitting
3.3.1. Temperature of seed photons and the four characteristic parameters
Finally, the eight parameters for every group of twin kHz QPOs were obtained by fitting with the observed energy spectrum and then comparing with the observed RMSL and RMSU (see Table B.1). In these solutions, all the values of kTb are in a small region (i.e 0.19–0.22 keV), which is within the range obtained from the spectral fitting result (Lin et al. 2007) and from Karpouzas et al. (2020). This suggests that it is reasonable to assume that the NS is encircled with a corona and that the energy exchange mainly occurs in the corona. However, a strong degeneracy between cold and hot seed photon models was shown in Lin et al. (2007) and Karpouzas et al. (2020). Although the seed photons in this study are cold, it remains to be explored whether these cold seed photons originate from the accretion disc and the hot seed photons from the NS when the accretion disc is introduced into our model. A positive correlation between flux and kTb for the 28 twin kHz QPOs is also shown in panel (a) of Fig. 2. According to the fitting result, there is a tight exponential fit between the flux and the temperature of the seed photons, that is to say, the flux can be expressed as  .
.
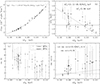 |
Fig. 2. Relation between the temperature of the seed photons on the NS and several variables. Panel a: Flux of 4U 1636–53 with different twin kHz QPOs. Panel b: Temperature of the electrons in the corona. Panel c: rms of twin kHz QPOs. Panel d: rms ratio of lower to upper QPOs. |
In panel (b), the constant function (2.96 ± 0.04) and the linear function (with the slope −48.45 ± 8.05 and the intercept −13.04 ± 1.67) were obtained by fitting the data when the errors were considered. According to the results, the linear function is statistically more suitable than the constant function for panel b, although the two reduced χ2 (11.78 and 27.17) from the fits are large. Thus, a weak negative correlation between kTe and kTb can be found. In panel (c) the rms for lower QPOs and upper QPOs decreases with the increasing kTb. In panel (d), the rms ratio (RMSL/RMSU) increases slightly with increasing kTb, but the trend is not obvious due to the large error of the rms ratio. There are similar reduced chi-squares for the fits using the constant function (rsm ratio = 0.58 ± 0.06) and using the linear function ( ), which are 0.98 and 1.06 respectively. The large errors of the fitted parameters originate from the data with large errors, which means that an obvious linear correlation between the rms ratio and kTb is not discovered.
3.3.2. Effect of the electron temperature on quasi-periodic oscillations and states
In panels (a) and (b) of Fig. 3, the correlations between the frequencies (or frequency ratio) of QPOs and the electron temperature are negative. The direct relation between the rms of QPOs and the electron temperature have not been discussed in theory, to our knowledge, but indirect dependencies between them and the state of the source may exist. It has been discussed that the frequencies of QPOs increase with the decreasing innermost radius of an accretion disc (e.g. Shi et al. 2014, 2018). In addition, the innermost radius of an accretion disc is related to the state of the source. Thus, the frequencies (or frequency ratio) of QPOs may be indirectly related to electron temperature. After carrying on linear fits, we find that the negative correlations between the frequencies of QPOs and electron temperature are weaker than that between frequency ratio and electron temperature. It means that the state of the source is more strongly associated with the frequency ratio than either the lower or upper QPO alone.
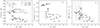 |
Fig. 3. Relation between the temperature of the electrons in the corona and the variables. Panel a: Frequencies of QPOs. Panel b: Frequency ratio of the lower to that of the upper QPOs. Panel c: rms ratio of lower to upper QPOs. |
Panel (c) of Fig. 3 shows a complex relation between the rms ratios of twin QPOs and the electron temperature, which may originate from the perturbed state. As discussed, the rms is related to nγ0 and δnγ0, which can be influenced by the system response to external perturbations. The state of the source leads to different distributions of the spectra. Thus the rms ratios will be different for the different distributions of the spectra and is affected by the state, Te, and external perturbation.
3.3.3. Ratio of the change in the heating rate
The corona will be heated after twin MHD waves are transported into it and will be disturbed so as to form the twin kHz QPOs. As shown in panel (a) of Fig. 4, the ratio of the change in the heating rate due to the twin MHD waves ( ) increases with the ratio of the twin frequencies (fL/fU). This means that the frequency ratio will affect
  . Essentially, the twin MHD waves will share the exchanged energy with the plasma. In addition, the frequency ratio is related to the propagation depth of MHD waves, which is affected by the damping of these waves due to energy dissipation mechanisms, such as Landau damping. However, the energy dissipation is also related to the density of plasma, and no good relation between fL/fU and L/L2 was found. Therefore, further investigation of the interaction between MHD waves and plasma is both intriguing and valuable.
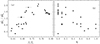 |
Fig. 4. Relations between the ratio of the changing heating rate (δHL/δHU) and the ratio of QPO frequencies, feedback coefficients when the central values of RMSL and RMSU are considered. |
Panel (b) of Fig. 4 shows a negative correlation between η and δHL/δHU. As the feedback coefficient increases, more energy is redirected back into the seed sources, enhancing the significance of the energy exchange from the lower-frequency waves. Consequently, the change rate of the heating rate for the lower-frequency waves becomes higher than that for the upper-frequency waves. A possible reason is that the lower waves lose energy more easily than the upper waves, and this needs to be explored.
3.4. Single parameter dependence
According to the expression of the rms of QPOs and the flux, the parameters that affect nγ and Δnγ also affect the rms of QPOs and the flux. However, some parameters that were used to calculate the rms of QPOs and the flux should be coupled with others (e.g. kTb and kTe, f and L, and L and τ), which leads to the complexity of a QPOs study and an incomplete consistency when only one parameter is changed below.
However, the results from changing one parameter are also similar may determine the key factor affecting the radiating system. Thus, the flux and rms ratio of twin kHz QPOs are calculated below when only one of the eight parameter is changed while the others are kept constant, as listed in Table B.1 for the same twin QPOs. In order to compare to the observation, the flux was calculated between 4 ∼ 23 keV in this subsection. The unabsorbed bolometric flux as the observed result in this study was obtained by using the model outlined in Zhang et al. (2017), accounting for the impact of interstellar absorption, with the column density fixed at NH = 3.1 × 1021 cm−2. As an example, the central values of the eight parameters for the twin kHz QPOs with the frequencies (νl = 883.44 ± 1.10 Hz, νu = 1132.73 ± 6.47 Hz) in Table B.1 are used in this subsection, except for the data marked by a plus and a cross in Fig. 5.
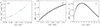 |
Fig. 5. Relations between the physical quantities used to match the observation and the fitted parameters. Panel a: Relations between the flux (4 ∼ 23 keV) and the temperature of the seed photons. The observed flux is marked by the plus, the model calculated flux is marked by the cross, and the flux marked by the star is obtained using the same parameters, which are the central values of the parameters for the twin kHz QPOs with the frequencies (νl = 883.44 ± 1.10 Hz, νu = 1132.73 ± 6.47 Hz) in Table B.1, except for the changed kTb. Panel b: Relations between the calculated rms ratio and the temperature of the seed photons. Panel c: Relations between the calculated rms ratio and the temperature of electrons. Note: The data in panels (b) and (c) were obtained when the parameters in Table B.1 for the above twin kHz QPOs were kept unchanged, except for kTb in panel (b), or were kept unchanged, except for kTe in panel (c). |
Panel (a) of Fig. 5 shows that the consistency of the observed flux and that from our model is reasonable. To understand dependence of the flux on kTb, we varied kTb while fixing all other parameters. In other words, we used the same set of values for all other parameters for the 28 observations (see the figure caption for details). This shows that the temperature of the seed photons is the dominating factor affecting the total flux of the source when inverse Compton scattering is the key component of the radiation.
In panel (b), the rms ratio increases with increasing kTb, and a similar tendency can also be seen in panel (d) of Fig. 2. In panel (c), the rms ratio first increases and then decreases with increasing kTe, which is similar to panel (c) of Fig. 3 for the higher kTe. These similarities suggest that altering a single parameter has only a limited effect on the twin QPOs, while the optimal parameter (kTb) with stable results also influences the radiation. However, the comparisons become more challenging because Figs. 2 and 3 consider the properties of the entire kHz QPO sample, whereas Fig. 5 primarily uses parameters for only one pair of kHz QPOs. This indicates that different combinations of the eight parameters will also lead to significant changes in the results.
4. Discussion
4.1. Physics behind the relations between the parameters
The intricate relation between kHz QPOs and the accretion-radiation processes within NS-LMXBs has been a subject of extensive exploration. KHz QPOs, characterized by their high-frequency nature, are considered valuable probes into the underlying physics governing accretion onto NSs. Their frequency is intricately connected to the accretion rate, a crucial parameter dictating the innermost radius of the accretion disc, and the innermost radius of the accretion disc plays a pivotal role in determining the frequency of kHz QPOs. The higher the accretion rate, the smaller the innermost radius, leading to an increase in the frequency of these oscillations. Several works, including those by Méndez et al. (1999, 2001), van Straaten et al. (2002), Done et al. (2007) and Altamirano et al. (2008), have investigated the intricate connection between the innermost radius of the accretion disc and the X-ray luminosity of the source. Further exploration by Zhang et al. (2017), Sanna et al. (2013) and Lyu et al. (2014) in the context of 4U 1636−53 has enriched our understanding of the interplay between spectral and timing properties.
Based on the simulation results presented in Sect. 3, we illustrated the accretion and radiation processes for kHz QPOs in NS-LMXBs, depicting both low and high accretion rate scenarios in Fig. 6. The effect of changes in the corona size relative to other parameters is not discussed here because no clear correlation has been found. Additionally, the transition between states, driven by the accumulation of material through the accretion process, requires a considerable amount of time. In the low-accretion state, the accretion disc is truncated by a strong magnetic field with a larger magnetosphere, and the NS exhibits a lower surface temperature that is covered by a higher temperature corona. In contrast, for a high accretion rate, the magnetosphere experiences a more intense compression, leading to a reduction in the magnetospheric radius. Consequently, the accretion disc moves closer to the NS, and the NS, now with a higher surface temperature, is covered by a lower temperature corona.
-
In panel (a) of Fig. 2, the flux of the source increases with the rising temperature of the seed photons (kTb). This correlation can be well described by an exponential function. This suggests that as the accretion rate increases, the higher temperature of the seed photons in the corona around the NS enhances the radiation of X-rays through Compton up-scattering. As illustrated in Eq. (1), the injection rate of the seed photons per unit volume increases with the ascending kTb. An approximate relation (
 ) can be derived. Consequently, more seed photons are scattered in the corona, and their energy is boosted by the scattering process. This leads to an exponential rise in flux from the scattering with increasing kTb.
 -
In contrast, the temperature of electrons in the corona decreases with the rising kTb, as depicted in panel (b) of Fig. 2, a phenomenon that was also discussed by Zhang et al. (2017). As explained earlier, the injection rate of seed photons increases with growing kTb, leading to a higher number density of the photons in the corona. The increased photon density intensifies the cooling process of the corona through the positive correlation between the cooling rate
 and the photon density. In other words, the temperature (kTe) decreases when the rising Compton cooling rate per electron surpasses the heating rate, as per Eq. (4).
It remains an open question to which depth MHD waves can be transported in the plasma accompanied with the strong magnetic field of an NS. Solving the problem will build up more knowledge of the relations between the parameters. This endeavor will advance the understanding of the interaction between plasma and MHD waves, such as the propagation length of MHD waves, the frequencies of kHz QPOs and the heating rate of the plasma from MHD waves.
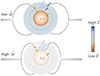 |
Fig. 6. Sketch of the accretion and radiation process accompanied with kHz QPOs for a low or high accretion rate. Here, Ṁ is the accretion rate of the disc, and T is the temperature of the corona. |
4.2. Possibly missing component in this model
The parameters (kTe, kTb, τ, L, and L2) were fitted to the spectra in the steady radiation. This is shown in Fig. 7. There are large discrepancies from zero for the residuals of the fitted spectra of about 6.4 ∼ 7.0 keV in almost every panel. This likely indicates strong radiation from Fe kα or kβ lines. In addition, the large discrepancies from zero for the residuals of the fitted spectra in E ≲ 4 keV in most panels mean that the fit deviates from the observation from Zhang et al. (2017) because the component of the accretion disc and the directly escaped BB component in the energy region are ignored in our fitting. This is shown in the fit of the characteristic spectrum in Fig. 3 of Zhang et al. (2017). In Fig. 8, the ratios of the observational central values of flux per keV to the results in this model from the fits of the spectra are obtained. The hump around 6.4 ∼ 7.0 keV may originate from the deficiency of Fe emission lines in the fits. In most panels, the ratios deviate from unity and systematic errors from the deficiency of ignoring the Fe emission lines and the soft components exist in the fits.
 |
Fig. 7. Fits and their residuals for the spectra in the 28 observations with the observation number in the upper right part of these panels in 4U 1636-53. The data are described by the dots from the fits of kTe, kTb, τ, L, and the data are described by the crosses from the fits of L2. All the units of the residuals are also |
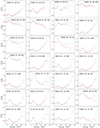 |
Fig. 8. Ratios of the observational central values of flux per keV to the results in the model from the fits of the spectra in the 28 observations with the observation number in the upper right part of these panels in 4U 1636-53. The data are described by the dots from the fits of kTe, kTb, τ, L, and the data are described by the crosses from the fits of L2. |
In addition, the reduced χ2 was computed to estimate the quality of our fits in Fig. 9. The reduced χ2 can be obtained with  , where N and N0 are the number of the data and the number of free parameters respectively. In addition, the general formula
 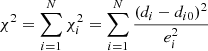 can be obtained according to the sum of every component (χi2) for the special energy photons, where di, ei, and di0 are the value of the observation, the error and the theoretical value in our model, respectively. As shown in most panels of Fig. 9 and Table 1, many components (χi2) of the reduced χ2 for the fit with the four parameters slightly deviate from unity, which is probably caused by the large errors of the parameters (kTe, τ, L) for the fit of the four parameters. However, the fit with L20 is very close to unity. The difference of χi2 between the two fits might be produced by the different fitting methods. The central values of the fitted parameters in the first fit are substituted into the second fit, and this means that the central values of kTe, kTb, τ, and L match the observation very well. In addition, the component (χi2) in most observations (e.g. 30053-02-01-001, 40028-01-02-00, 60032-01-19-00, 60032-01-21-000, and 93087-01-03-20) increases with the energy. This suggests that another component of the accretion system might be missing from the fit. As proposed in our model, the accretion disc in 4U 1636−53 was omitted, and this may be one of the reasons for the missing X-ray component in 4U 1636−53. The humps in Fig. 9 (e.g. 10088-01-06-04, 10088-01-06-010, 50032-02-06-00, 60032-01-21-00, and 60032-05-08-00) around 6.4 ∼ 7.0 keV may also be produced by the omitted Fe lines in the fits. Accordingly, the fits may help us to identify the missing components and the possible states of an XB related to the NS, the corona, the accretion disc, and other factors. These components cannot be well constrained by RXTE data. In our future models, we will include the disc and reflection components and test them using NICER data and the upcoming eXTP data.
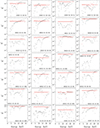 |
Fig. 9. χi2 component from the fits of the spectra in the 28 observations with the observation number in the upper right part of these panels in 4U 1636-53. The data are described by the plus sign from the fits of kTe, kTb, τ, L, and the data are described by circles from the fits of L2. |
Comparison of the characteristic parameters.
4.3. Origin of QPOs
Although flare-related QPPs occur in the Sun but QPOs occur in NS-LMXBs, they may have the same physical process but are shown in different wave bands, which should originate from different radiation mechanisms (e.g. gyrosynchrotron in the Sun and Compton up-scattering in NS-LMXBs). First, the arched magnetic field lines in the corona of the Sun are similar to the dipolar magnetic field lines of NSs. The magnetic field with arched field lines can cause particles to be accelerated or decelerated, which produces electromagnetic waves (e.g. X-rays). Then, MHD waves lead to the oscillation of the magnetic field in a large region in a corona, and some similar oscillation may also be produced in NS-LMXBs and in the Sun. Finally, the dynamic interaction of waves and energetic particles appears in the region, and X-ray variabilities can be produced. According to the analysis, we can estimate that a magnetic field with arched field lines may be needed to produce QPOs. However, the oscillations from different origins may lead to different types of QPOs. In the Sun, the short-period QPPs detected in radio and microwave emissions are considered to be related to the dynamic interaction of waves and energetic particles, while the long-period QPPs that are observed in white light, UV, and extreme-UV wavebands are usually thought to be associated with the dynamics of plasma. In brief, waves interacting with the plasmas and produced by dynamics may be the origin of QPOs. The reported arched quasi-periodic fast magnetoacoustic waves propagating away from the flare site (Liu et al. 2011) were found to be consistent with the periodicity of QPPs in the flare light curve, which may suggest the origin of QPPs. It helps us to understand QPOs in LMXBs and other celestial bodies. However, gravity magnetoacoustic waves may be a promising origin of QPOs because of the very strong gravity and magnetic field of an NS.
We compared the frequencies of QPPs and QPOs (ν) and estimated them by using the expression of the frequency of Alfen waves (kVA ∼ VA/rc), which has a similar frequency as magnetoacoustic waves ( ), where k, VA, ω, CS, and rc are the wave number, the Alfen speed, the angular frequency and the sonic speed of a MHD wave, and the characteristic length of the magnetic field lines, respectively. The frequency ratio of kHz QPOs to QPPs (102 ∼ 106) is consistent with the ratio of kVA (102 ∼ 108) that is obtained by substituting the relations (
 , ρ ∼ n) and the characteristic parameters in Table 1 into the frequency expression, where B, μ, ρ, and n are the characteristic magnetic field, magnetic conductivity, density, and number density of plasma, respectively. This ratio supports the connection between the kHz QPOs and the frequencies of QPPs. This correlation does not exclude the possibility that the oscillations in the plasma are generated by other physical processes, such as rotation, magnetic reconnection, or precession, within the mechanism of QPOs.
We found that lower QPOs are produced in the entire corona, but upper QPOs are produced in the outermost layer of the corona. The seed photons producing the upper QPOs are from the radiation in the inner layer and harder than the BB seed photons from the NS on average. It was also reported that scattering in the upper layers of an NS corona produced a hardening of the spectra (Lapidus et al. 1986; London et al. 1986). Thus the average energy of the last photons producing the upper QPOs should be higher than that of the photons for the lower QPOs. This may be the key reason that the lower QPOs have a different rms from the upper QPOs. In addition, most of the soft photons from the inner layer will travel a longer distance than hard photons, and thus, many soft photons will take a longer time to arrive at the surface of the corona, which can partially explain the time lag between soft and hard X-ray photons. These two characteristics are the key differences between the upper and the lower QPOs, which will be studied in a next work. Finally, a single MHD wave, which may be the origin of the single kHz QPO (Shi et al. 2014), can also perturb the physical quantities and leads to the kHz X-ray variability. Therefore, the radiation mechanism of the single kHz QPOs can be further investigated based on the findings of this study.
5. Conclusion
We combine the dynamic mechanism and radiation process of the twin kHz QPOs described by Compton up-scattering, in which 28 twin kHz QPOs in 4U 1636−53 were considered. The parameters in the corona around the NS in the LMXB for the 28 twin kHz QPOs were obtained with a Monte Carlo method. Our conclusions are summarized bellow.
-
The interaction between MHD waves and plasma in one part of a corona can be explored by layering the corona. QPOs can be considered as a disturbance superimposed on the radiation of the radiation field in a quasi-steady state.
-
Twin disturbances from twin MHD waves produced at the innermost radius of an accretion disc can be considered as the origin of QPOs. Seed photons may be transported through a high-temperature corona and scattered by the Compton up-scattering mechanism. Finally, the variability of radiation photons with the frequencies of the twin MHD waves will lead to the observed twin kHz QPOs.
-
According to this model, the calculated flux of the source increases sensitively with the increasing temperature of the seed photons. In addition, the rms ratio of lower QPOs to that of upper QPOs increases slightly with the increasing temperature of the seed photons.
-
Considering the chosen best parameters, we obtained a weak relations between kTe and f, fL/fU, and RMSL/RMSU. With the increasing electron temperature, all the three parameters decreased, which shows that the observational characteristics of QPOs might be closely linked to the accretion state of the source. In addition, negative correlations also exist between kTe and kTb.
In summary, twin kHz QPOs can be considered to originate from the oscillating physical parameters of the plasma in the entire corona and in a part of the corona. Twin kHz QPOs may be a key tool for determining the innermost radius of an accretion disc, studying the characteristics of the state in LMXBs, testing the effect of general relativity, estimating the parameters of compact stars, and exploring the new MHD waves (gravity magnetoacoustic waves).
Acknowledgments
We thank Philipp Podsiadlowski, Mariano Méndez, Konstantinos Karpouzas and Adam Ingram for the helpful discussion. This work was supported by the Hainan Provincial Natural Science Foundation of China under grant Nos. 122RC546, 124CXTD422, the National Natural Science Foundation of China under grant Nos. 12373043, 12063001, 11563003, 12333007, 12027803, 12041301, and 12121003, and the National Key Research and Development Program of China (2021YFA0718500). GB acknowledge the science research grants from the China Manned Space Project.
References
- Abramowicz, M. A., Bulik, T., Bursa, M., & Kluźniak, W. 2003, A&A, 404, L21 [NASA ADS] [CrossRef] [EDP Sciences] [Google Scholar]
- Altamirano, D., van der Klis, M., Méndez, M., et al. 2008, ApJ, 685, 436 [NASA ADS] [CrossRef] [Google Scholar]
- Barret, D., Olive, J.-F., & Miller, M. C. 2005, MNRAS, 361, 855 [NASA ADS] [CrossRef] [Google Scholar]
- Berger, M., van der Klis, M., van Paradijs, J., et al. 1996, ApJ, 469, L13 [NASA ADS] [CrossRef] [Google Scholar]
- Done, C., Gierliński, M., & Kubota, A. 2007, A&ARv, 15, 1 [Google Scholar]
- Galloway, D. K., Psaltis, D., Muno, M. P., et al. 2006, ApJ, 639, 1033 [NASA ADS] [CrossRef] [Google Scholar]
- Gilfanov, M., Revnivtsev, M., & Molkov, S. 2003, A&A, 410, 217 [NASA ADS] [CrossRef] [EDP Sciences] [Google Scholar]
- Ingram, A., & Done, C. 2011, MNRAS, 415, 2323 [NASA ADS] [CrossRef] [Google Scholar]
- Karpouzas, K., Méndez, M., Ribeiro, E. M., et al. 2020, MNRAS, 492, 1399 [CrossRef] [Google Scholar]
- Kompaneets, A. S. 1957, Sov. J. Exp. Theor. Phys., 4, 730 [Google Scholar]
- Kumar, N., & Misra, R. 2014, MNRAS, 445, 2818 [CrossRef] [Google Scholar]
- Lapidus, I. I., Syunyaev, R. A., & Titarchuk, L. G. 1986, SvAL, 12, 383 [NASA ADS] [Google Scholar]
- Lee, H. C., & Miller, G. S. 1998, MNRAS, 299, 479 [NASA ADS] [CrossRef] [Google Scholar]
- Lee, H. C., Misra, R., & Taam, R. E. 2001, ApJ, 549, L229 [NASA ADS] [CrossRef] [Google Scholar]
- Lin, D., Remillard, R. A., & Homan, J. 2007, ApJ, 667, 1073 [CrossRef] [Google Scholar]
- Liu, W., Title, A., Zhao, J., et al. 2011, ApJL, 736, L13 [NASA ADS] [CrossRef] [Google Scholar]
- London, R. A., Taam, R. E., & Howard, W. M. 1986, ApJ, 306, 170 [Google Scholar]
- Lyu, M., Méndez, M., Sanna, A., et al. 2014, MNRAS, 440, 1165 [CrossRef] [Google Scholar]
- Méndez, M. 2006, MNRAS, 371, 1925 [CrossRef] [Google Scholar]
- Méndez, M., van der Klis, M., Ford, E. C., Wijnands, R., & van Paradijs, J. 1999, ApJ, 511, L49 [Google Scholar]
- Méndez, M., van der Klis, M., & Ford, E. C. 2001, ApJ, 561, 1016 [Google Scholar]
- Miller, M. C., Lamb, F. K., & Psaltis, D. 1998, ApJ, 508, 791 [NASA ADS] [CrossRef] [Google Scholar]
- Mukherjee, A., & Bhattacharyya, S. 2012, ApJ, 756, 55 [NASA ADS] [CrossRef] [Google Scholar]
- Nakariakov, V. M., & Melnikov, V. F. 2009, Space Sci. Rev., 149, 119 [Google Scholar]
- Nakariakov, V. M., Tsiklauri, D., Kelly, A., Arber, T. D., & Aschwanden, M. J. 2004, A&A, 414, L25 [NASA ADS] [CrossRef] [EDP Sciences] [Google Scholar]
- Osherovich, V., & Titarchuk, L. 1999, ApJ, 522, L113 [NASA ADS] [CrossRef] [Google Scholar]
- Psaltis, D., & Lamb, F. K. 1997, ApJ, 488, 881 [NASA ADS] [CrossRef] [Google Scholar]
- Ribeiro, E. M., Méndez, M., Zhang, G., & Sanna, A. 2017, MNRAS, 471, 1208 [NASA ADS] [CrossRef] [Google Scholar]
- Sanna, A., Hiemstra, B., Méndez, M., et al. 2013, MNRAS, 432, 1144 [NASA ADS] [CrossRef] [Google Scholar]
- Shi, C. 2010, Sci. China: Phys. Mech. Astron., 53, 247 [NASA ADS] [CrossRef] [Google Scholar]
- Shi, C. 2021, MNRAS, 504, 2961 [CrossRef] [Google Scholar]
- Shi, C., & Li, X.-D. 2009, MNRAS, 392, 264 [NASA ADS] [CrossRef] [Google Scholar]
- Shi, C.-S., & Li, X.-D. 2010, ApJ, 714, 1227 [NASA ADS] [CrossRef] [Google Scholar]
- Shi, C.-S., Zhang, S.-N., & Li, X.-D. 2014, ApJ, 791, 16 [NASA ADS] [CrossRef] [Google Scholar]
- Shi, C.-S., Zhang, S.-N., & Li, X.-D. 2018, MNRAS, 479, 5049 [NASA ADS] [Google Scholar]
- Somov, B. V. 2012, Plasma Astrophysics, Part I: Fundamentals and Practice (New York: Springer) [Google Scholar]
- Stella, L., & Vietri, M. 1999, Phys. Rev. Lett., 82, 17 [NASA ADS] [CrossRef] [Google Scholar]
- Titarchuk, L., & Shaposhnikov, N. 2005, ApJ, 626, 298 [NASA ADS] [CrossRef] [Google Scholar]
- van der Klis, M. 2006, Camb. Astrophys. Ser., 39, 39 [NASA ADS] [Google Scholar]
- van Straaten, S., van der Klis, M., di Salvo, T., & Belloni, T. 2002, ApJ, 568, 912 [NASA ADS] [CrossRef] [Google Scholar]
- Wijnands, R. 2006, Trends in Pulsar Research , 53 [Google Scholar]
- Yu, W., Zhang, S. N., Harmon, B. A., et al. 1997, ApJ, 490, L153 [NASA ADS] [CrossRef] [Google Scholar]
- Zdziarski, A. A., Gierliński, M., Rao, A. R., Vadawale, S. V., & Mikołajewska, J. 2005, MNRAS, 360, 825 [NASA ADS] [CrossRef] [Google Scholar]
- Zhang, W., Lapidus, I., White, N. E., & Titarchuk, L. 1996, ApJ, 469, L17 [NASA ADS] [CrossRef] [Google Scholar]
- Zhang, G., Méndez, M., Sanna, A., Ribeiro, E. M., & Gelfand, J. D. 2017, MNRAS, 465, 5003 [NASA ADS] [CrossRef] [Google Scholar]
- Zimovets, I. V., McLaughlin, J. A., Srivastava, A. K., et al. 2021, Space Sci. Rev., 217, 66 [NASA ADS] [CrossRef] [Google Scholar]
Appendix A: The formula of Compton scattering
The parameter (ε) in Kompaneets equations can be expressed as,
 (A.1)
(A.1)
The Klein-Nishina cross section is,
![Mathematical equation: $$ \begin{aligned} \begin{aligned} \sigma _{\rm KN}=&\frac{3}{4}{\sigma }_{\rm T}[\frac{1+x}{x^3}(\frac{2x\left(1+x\right)}{1+2x}-\ln {\left(1+2x\right))}&+\frac{\ln {\left(1+2x\right)}}{2x}-\frac{1+3x}{{(1+2x)}^2}], \end{aligned} \end{aligned} $$](/articles/aa/full_html/2024/11/aa49728-24/aa49728-24-eq62.gif) (A.2)
(A.2)
where  .
.
Appendix B: The parameters in the states of 4U 1636−53 with 28 twin kHz QPOs
Frequencies of twin kHz QPOs and the best parameters in 4U 1636–53.
All Tables
All Figures
|
Fig. 1. Sketch of the process that generates twin MHD waves at the innermost radius of the accretion disc in an LMXB, which transports the waves along the magnetic field lines and radiates X-ray photons from the surface of the corona. The temperature and density are the same in the whole corona in steady radiation. The magnetic field lines are marked by the dotted black curves. |
| In the text | |
|
Fig. 2. Relation between the temperature of the seed photons on the NS and several variables. Panel a: Flux of 4U 1636–53 with different twin kHz QPOs. Panel b: Temperature of the electrons in the corona. Panel c: rms of twin kHz QPOs. Panel d: rms ratio of lower to upper QPOs. |
| In the text | |
|
Fig. 3. Relation between the temperature of the electrons in the corona and the variables. Panel a: Frequencies of QPOs. Panel b: Frequency ratio of the lower to that of the upper QPOs. Panel c: rms ratio of lower to upper QPOs. |
| In the text | |
|
Fig. 4. Relations between the ratio of the changing heating rate (δHL/δHU) and the ratio of QPO frequencies, feedback coefficients when the central values of RMSL and RMSU are considered. |
| In the text | |
|
Fig. 5. Relations between the physical quantities used to match the observation and the fitted parameters. Panel a: Relations between the flux (4 ∼ 23 keV) and the temperature of the seed photons. The observed flux is marked by the plus, the model calculated flux is marked by the cross, and the flux marked by the star is obtained using the same parameters, which are the central values of the parameters for the twin kHz QPOs with the frequencies (νl = 883.44 ± 1.10 Hz, νu = 1132.73 ± 6.47 Hz) in Table B.1, except for the changed kTb. Panel b: Relations between the calculated rms ratio and the temperature of the seed photons. Panel c: Relations between the calculated rms ratio and the temperature of electrons. Note: The data in panels (b) and (c) were obtained when the parameters in Table B.1 for the above twin kHz QPOs were kept unchanged, except for kTb in panel (b), or were kept unchanged, except for kTe in panel (c). |
| In the text | |
|
Fig. 6. Sketch of the accretion and radiation process accompanied with kHz QPOs for a low or high accretion rate. Here, Ṁ is the accretion rate of the disc, and T is the temperature of the corona. |
| In the text | |
|
Fig. 7. Fits and their residuals for the spectra in the 28 observations with the observation number in the upper right part of these panels in 4U 1636-53. The data are described by the dots from the fits of kTe, kTb, τ, L, and the data are described by the crosses from the fits of L2. All the units of the residuals are also |
| In the text | |
|
Fig. 8. Ratios of the observational central values of flux per keV to the results in the model from the fits of the spectra in the 28 observations with the observation number in the upper right part of these panels in 4U 1636-53. The data are described by the dots from the fits of kTe, kTb, τ, L, and the data are described by the crosses from the fits of L2. |
| In the text | |
|
Fig. 9. χi2 component from the fits of the spectra in the 28 observations with the observation number in the upper right part of these panels in 4U 1636-53. The data are described by the plus sign from the fits of kTe, kTb, τ, L, and the data are described by circles from the fits of L2. |
| In the text | |
Current usage metrics show cumulative count of Article Views (full-text article views including HTML views, PDF and ePub downloads, according to the available data) and Abstracts Views on Vision4Press platform.
Data correspond to usage on the plateform after 2015. The current usage metrics is available 48-96 hours after online publication and is updated daily on week days.
Initial download of the metrics may take a while.