Fig. 8.
Download original image
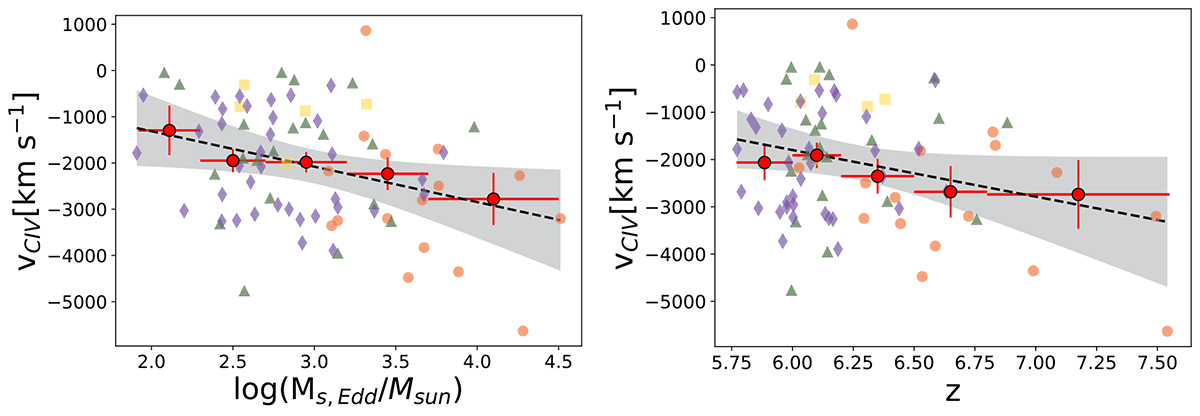
Plot of the relations which do not involve X-ray data extending the data sample. Left panel: vC․IV vs. log(Ms, Edd) linear relation; Right panel: vC․IV vs. z linear relation. The orange circles and the yellow squares represent the HYPERION and non-HYPERION QSOs in our sample, respectively. The green triangles and the purple diamonds represent the QSOs from Farina et al. 2022 and Mazzucchelli et al. 2023, respectively. the red circles with errorbars correspond to the median value for each bin. The dashed black lines are the linear regressions while the shaded regions represent the combined 1σ error on the slope and normalization (see Table 6).
Current usage metrics show cumulative count of Article Views (full-text article views including HTML views, PDF and ePub downloads, according to the available data) and Abstracts Views on Vision4Press platform.
Data correspond to usage on the plateform after 2015. The current usage metrics is available 48-96 hours after online publication and is updated daily on week days.
Initial download of the metrics may take a while.