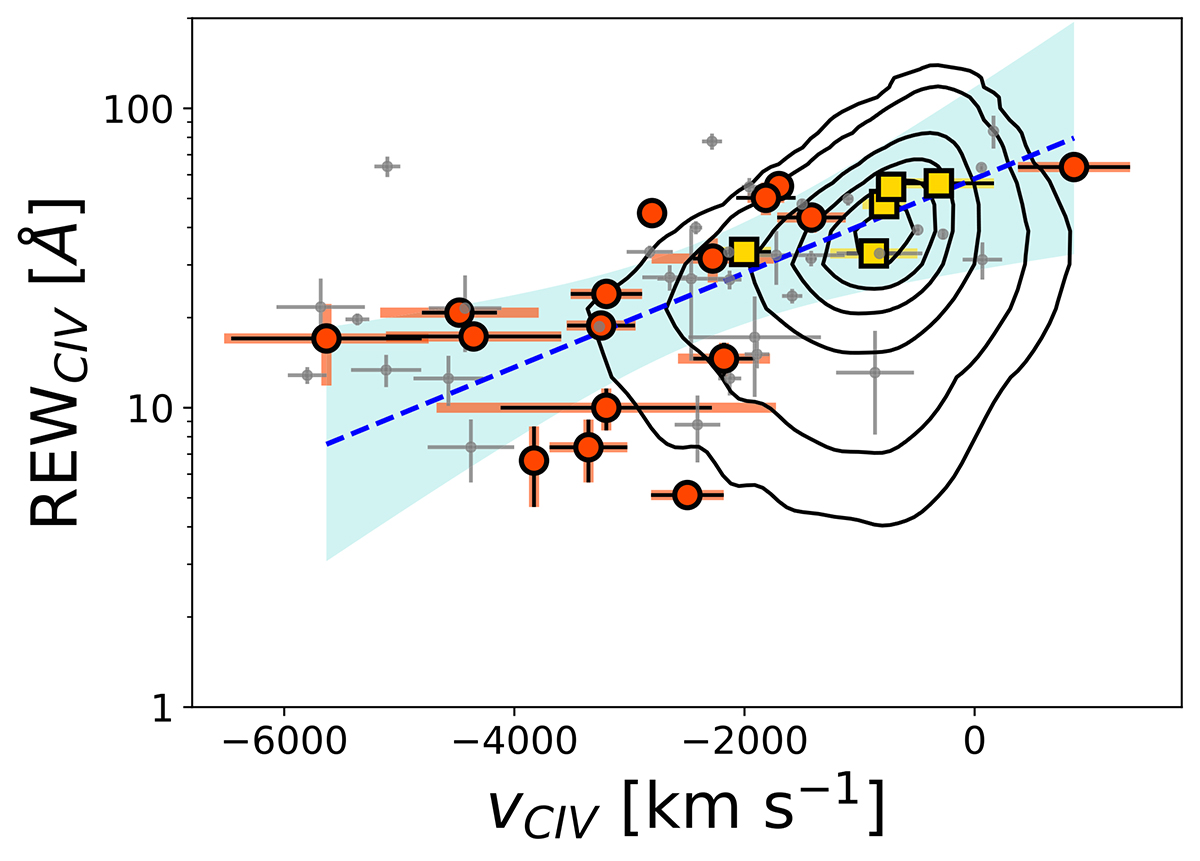
Fig. 3.
Download original image
The REWC IV vs. vC․IV relation compared with the 0.05, 0.1, 0.3, 0.5, 0.68, 0.9 and 0.99 contour levels (relative to the peak) of the SDSS DR7 sample (Shen et al. 2011; Vietri et al. 2018) and with the values from Schindler et al. 2020 (grey points). For simplicity, we plot here the mean values derived using all the available values reported in Table 3. We note that the fit takes into account all the existing values of vC․IV and REWC IV(see Section 3.2).
Current usage metrics show cumulative count of Article Views (full-text article views including HTML views, PDF and ePub downloads, according to the available data) and Abstracts Views on Vision4Press platform.
Data correspond to usage on the plateform after 2015. The current usage metrics is available 48-96 hours after online publication and is updated daily on week days.
Initial download of the metrics may take a while.