Fig. 2.
Download original image
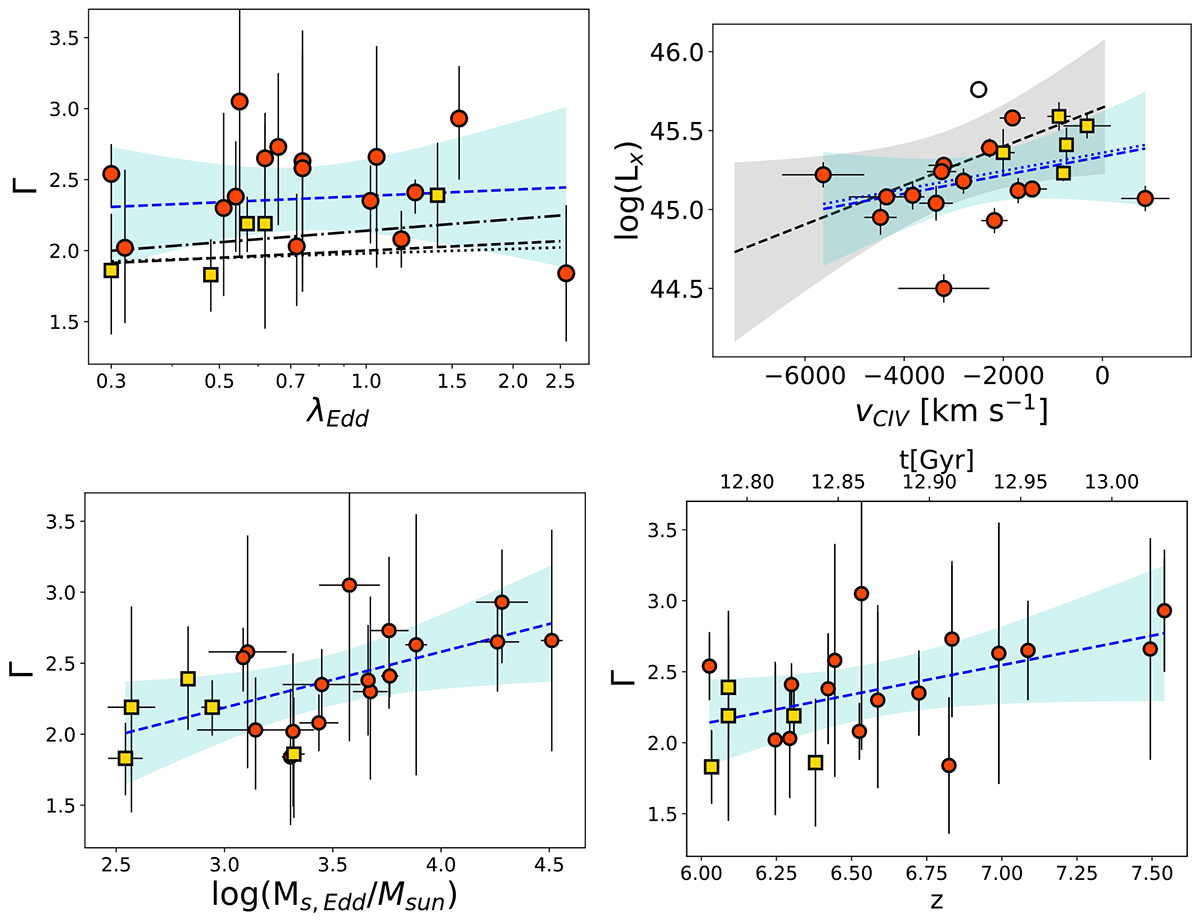
Plots of some of the correlations tested for this work. Upper left panel: Γ vs. log(λEdd). We report for comparison the linear relations from Trakhtenbrot et al. 2017 (black dashed line), Liu et al. 2021 (black dot-dashed line) and Tortosa et al. 2023 (black dotted line); Upper right panel: vC․IV vs. Lx, we also report the linear relation (black dashed line) and the combined 1σ error on the slope and normalization (grey shaded region) from Zappacosta et al. (2020). The empty dot is SDSS J0100+2802, which is not included in the fitting process given its different value of Lbol (see Section 5.2). The blue dotted line is the linear relation when including SDSS J0100+2802. We also report the linear relation from Zappacosta et al. 2020 (black dotted line). The vC․IV values plotted here are, for simplicity, the mean values derived using all the available values reported in Table 3. We note that the fit takes into account all the existing values of vC․IV (see Section 3.2); Lower left panel: Γ vs. log(Ms, Edd); Lower right panel: Γ vs. z.
Current usage metrics show cumulative count of Article Views (full-text article views including HTML views, PDF and ePub downloads, according to the available data) and Abstracts Views on Vision4Press platform.
Data correspond to usage on the plateform after 2015. The current usage metrics is available 48-96 hours after online publication and is updated daily on week days.
Initial download of the metrics may take a while.