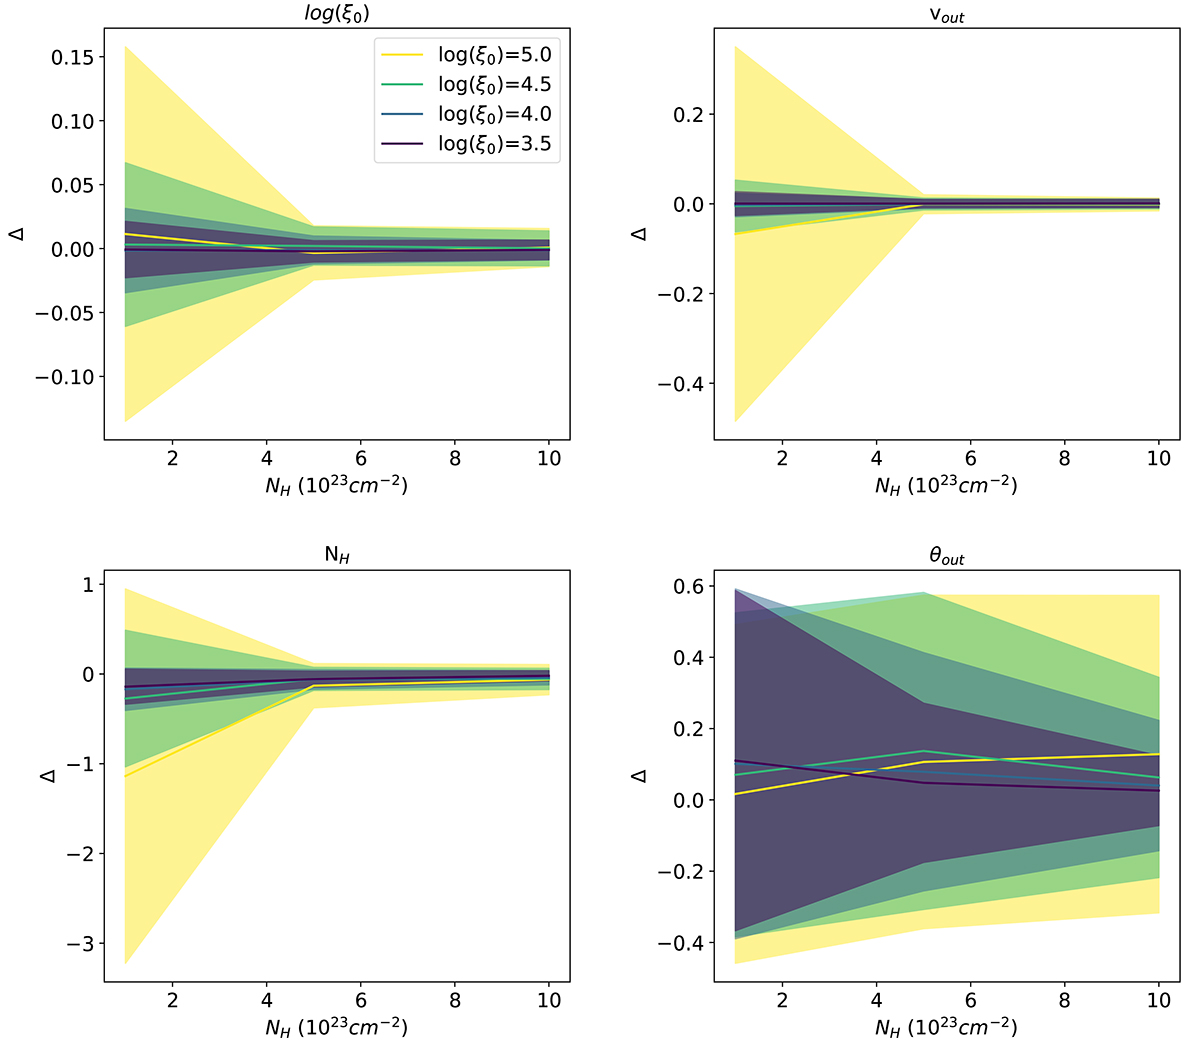
Fig. 9.
Download original image
Ratio, Δ (re-scaled to 0; see Eq. 16), between input and best-fit values for XRISM Resolve simulations, as a function of the input, NH. The shaded areas show the corresponding standard deviation. The colour coding corresponds to the different input log(ξ0) (see legend). From left to right and top to bottom, the different panels correspond to the best-fit distributions of log(ξ),v0, NH, θout, respectively. For ease of visualisation, we only report the results after the inclusion of the emission component. Note that, in the last panel, only those simulations with inputs of θout > 45deg are included.
Current usage metrics show cumulative count of Article Views (full-text article views including HTML views, PDF and ePub downloads, according to the available data) and Abstracts Views on Vision4Press platform.
Data correspond to usage on the plateform after 2015. The current usage metrics is available 48-96 hours after online publication and is updated daily on week days.
Initial download of the metrics may take a while.