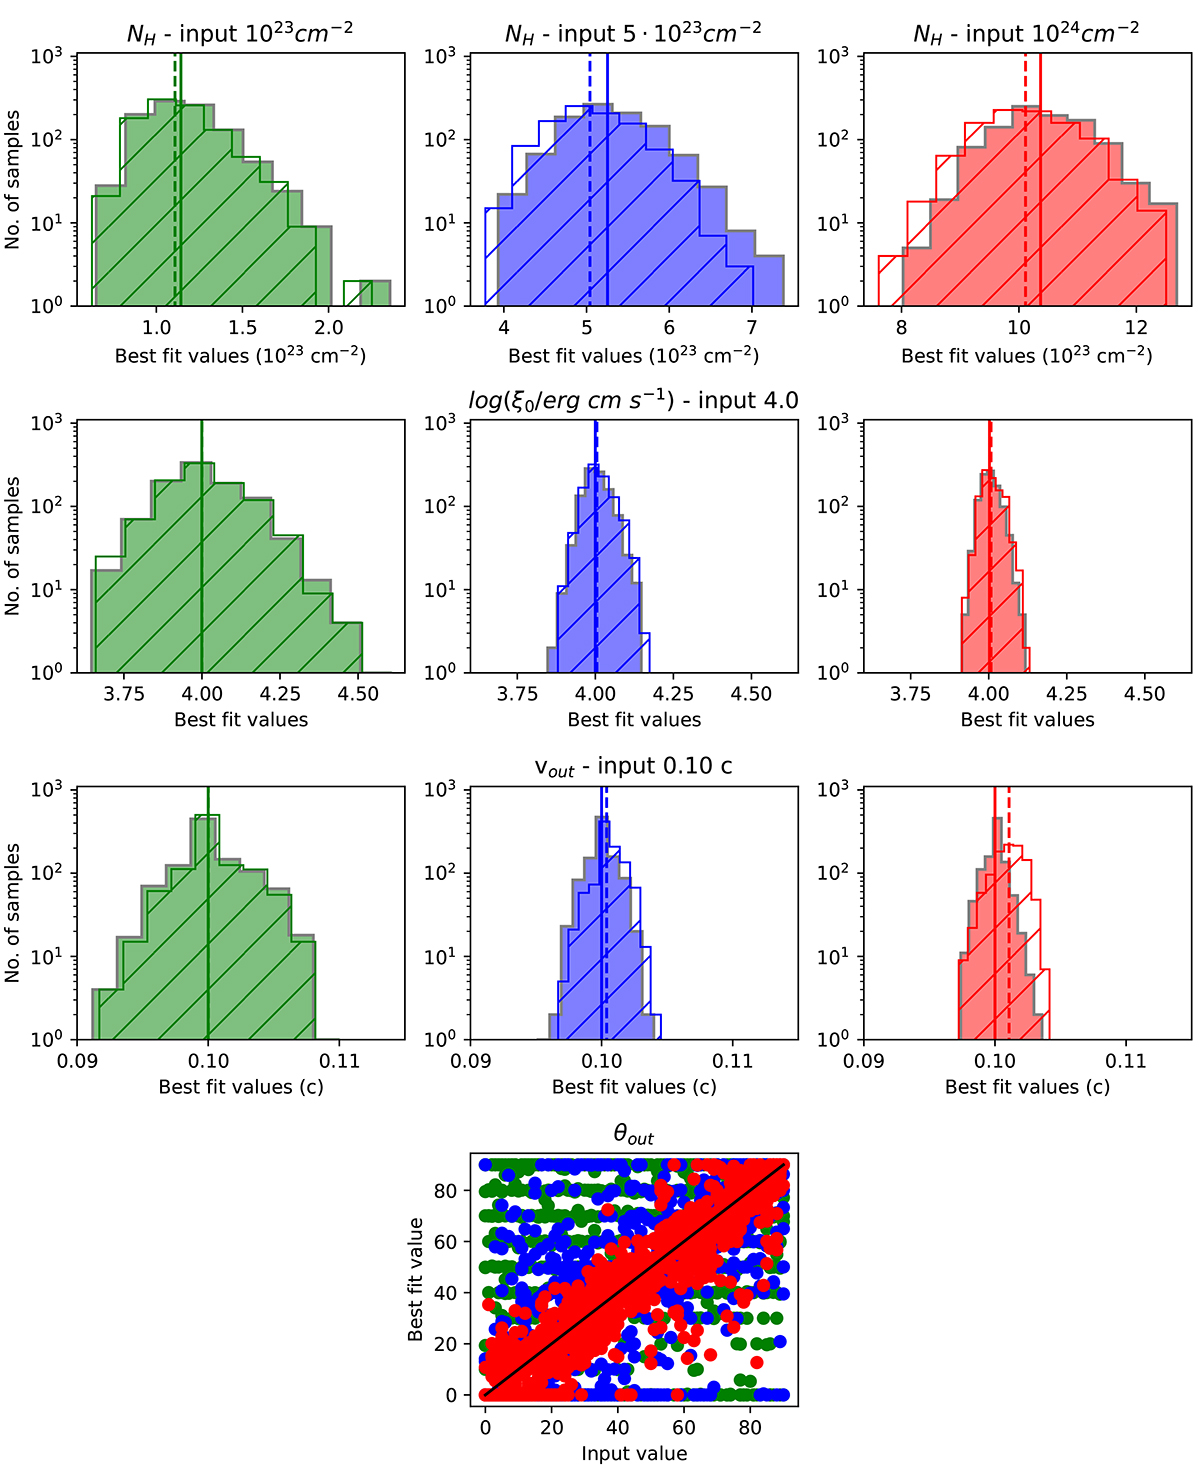
Fig. 8.
Download original image
Distribution of the best-fit values of 1000 XRISM Resolve simulations, using as input values log(ξ) = 4.0, v0 = 0.10c and three different NH = 1023, 5 ⋅ 1023, 1024 (left, centre, and right column, respectively). The top, centre, and bottom rows report the best-fit values for NH, log(ξ),v0, respectively. Hatched and filled histograms correspond to the distributions before and after the inclusion of the emission component, respectively. Dashed and solid lines are the median values of the two distributions. Finally, the last panel reports the best-fit values of θout as a function of the input ones.
Current usage metrics show cumulative count of Article Views (full-text article views including HTML views, PDF and ePub downloads, according to the available data) and Abstracts Views on Vision4Press platform.
Data correspond to usage on the plateform after 2015. The current usage metrics is available 48-96 hours after online publication and is updated daily on week days.
Initial download of the metrics may take a while.