Open Access
Fig. 7.
Download original image
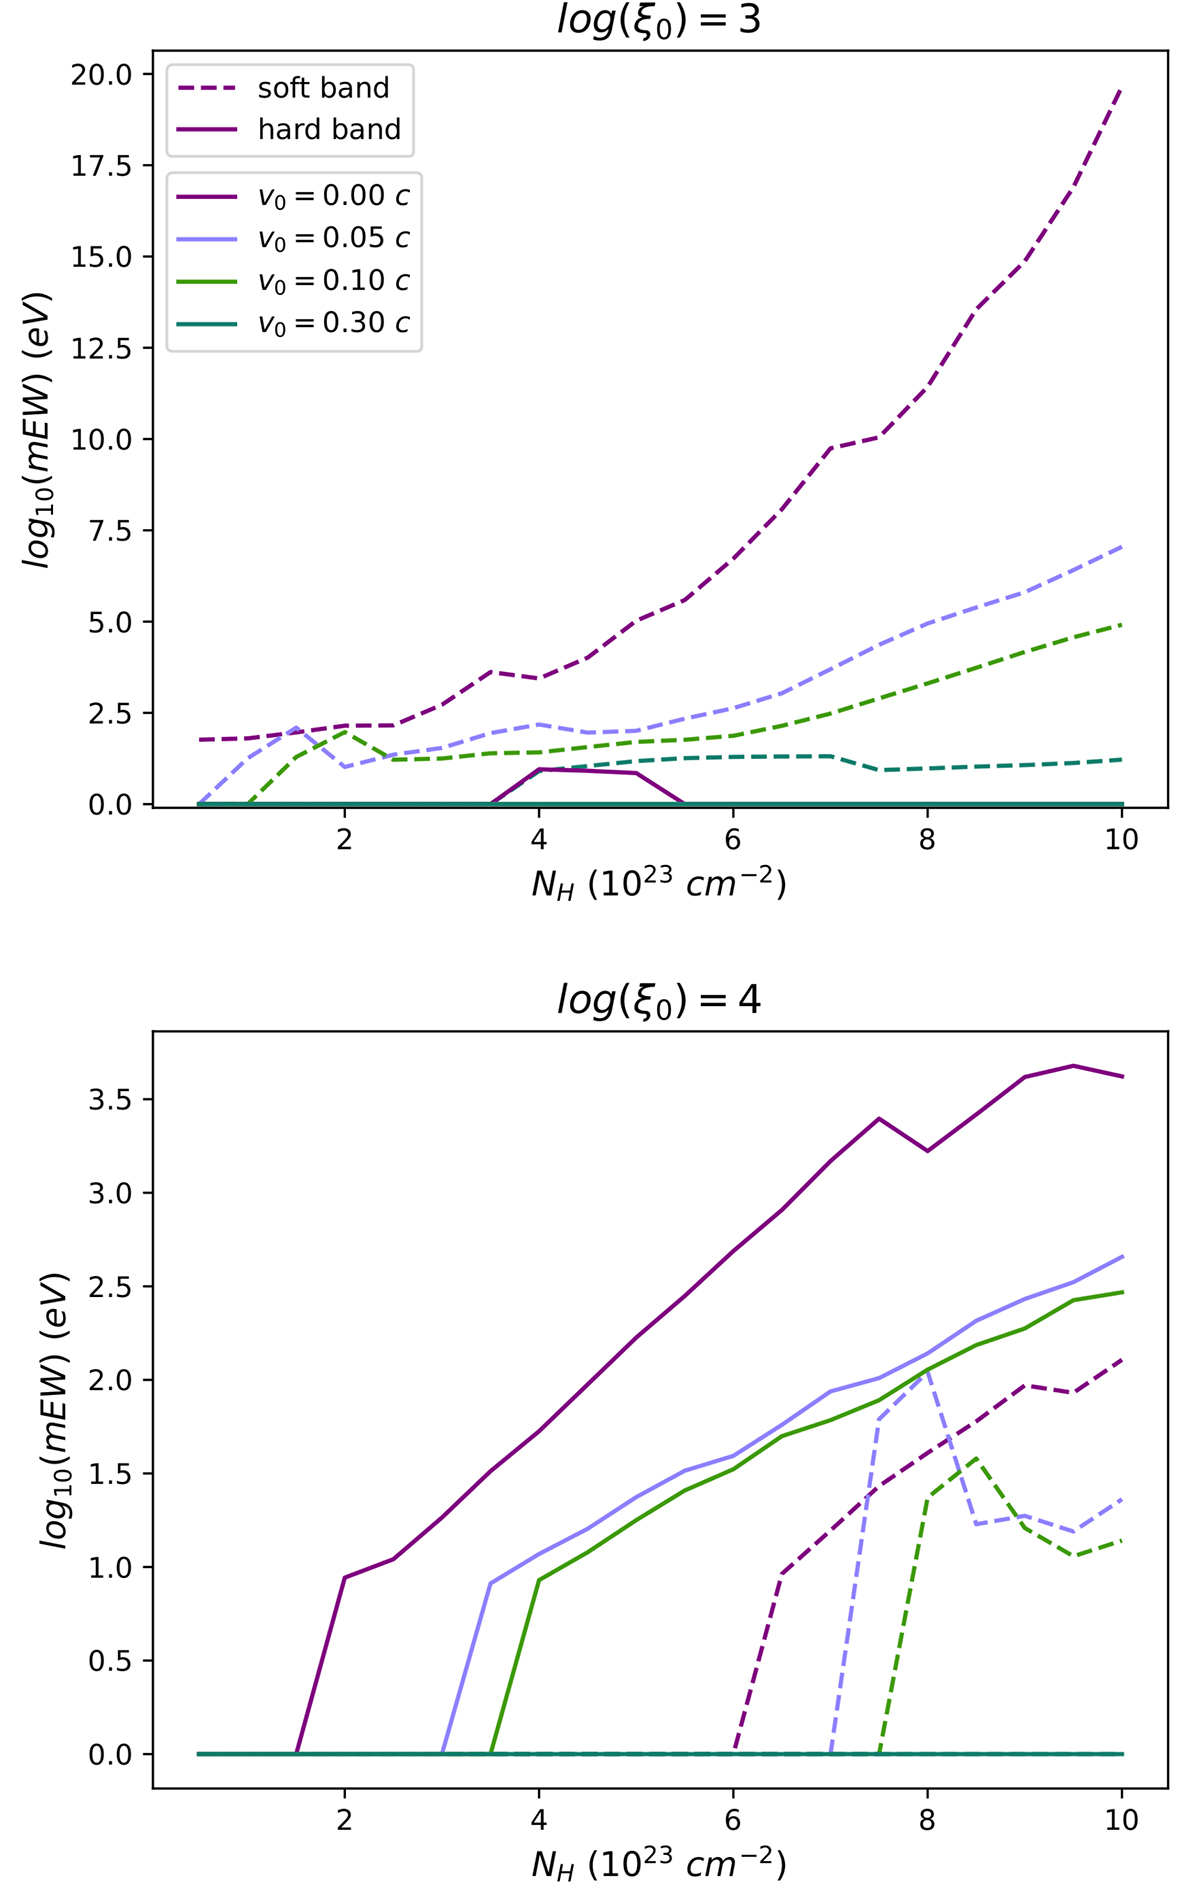
Logarithm of the mEW of the wind emission as a function of NH, plotted for increasing v0 (colour coding, see legend). The soft and hard X-ray bands, corresponding to 0.5–2.5 and 5–15 keV, respectively, are shown with dashed and solid lines. The top and bottom panels correspond to log(ξ0) = 3, 4, respectively.
Current usage metrics show cumulative count of Article Views (full-text article views including HTML views, PDF and ePub downloads, according to the available data) and Abstracts Views on Vision4Press platform.
Data correspond to usage on the plateform after 2015. The current usage metrics is available 48-96 hours after online publication and is updated daily on week days.
Initial download of the metrics may take a while.