Fig. 5.
Download original image
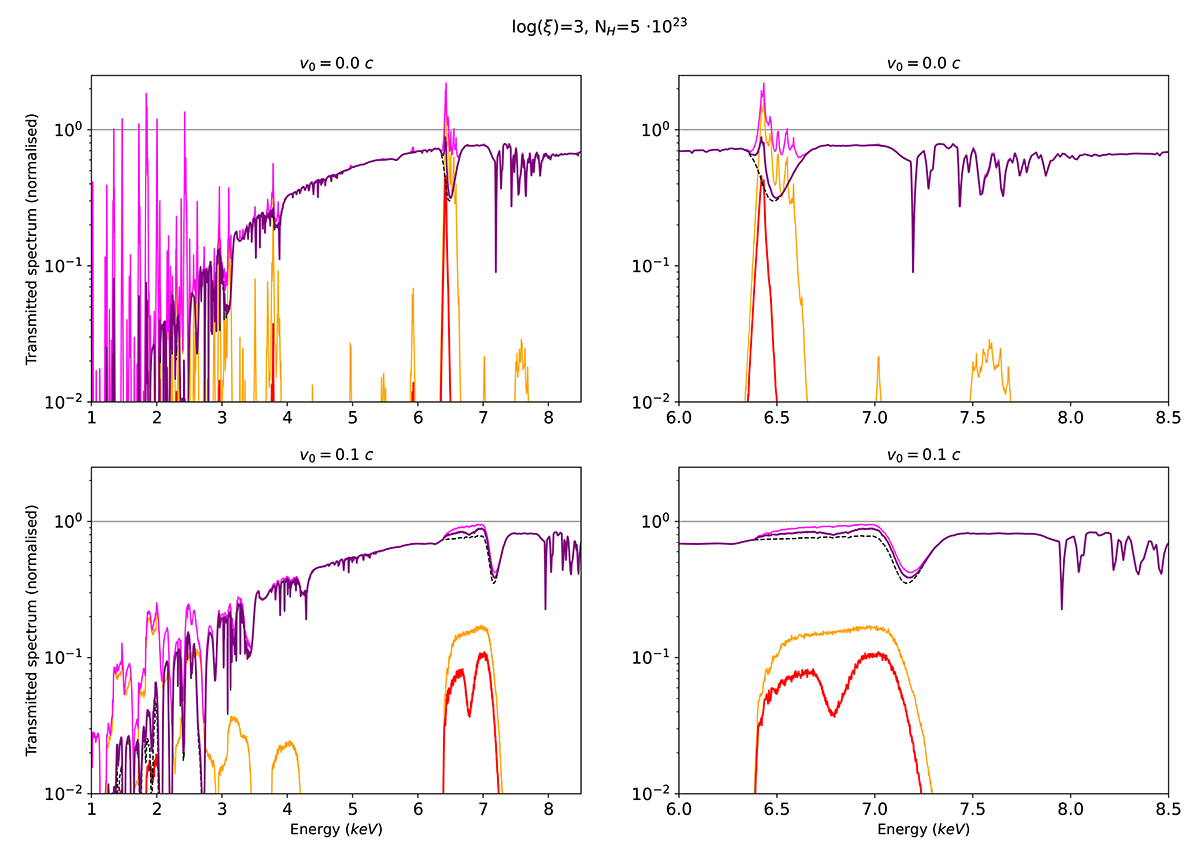
WINE spectrum for log(ξ0) = 3, NH = 5 ⋅ 1023 and v0 = 0.0, 0.1 c (top and bottom row, respectively). The left panels show the E = 1–8.5 keV spectrum, while the right panels zoom in above E = 6 keV. Orange(red) lines represent the emission spectrum and pink(purple) the total (absorption + emission) spectrum for Cv = 0(1). The absorption spectrum is shown with dashed black lines. For ease of visualisation, the spectra are divided by the incident continuum.
Current usage metrics show cumulative count of Article Views (full-text article views including HTML views, PDF and ePub downloads, according to the available data) and Abstracts Views on Vision4Press platform.
Data correspond to usage on the plateform after 2015. The current usage metrics is available 48-96 hours after online publication and is updated daily on week days.
Initial download of the metrics may take a while.