Fig. 3.
Download original image
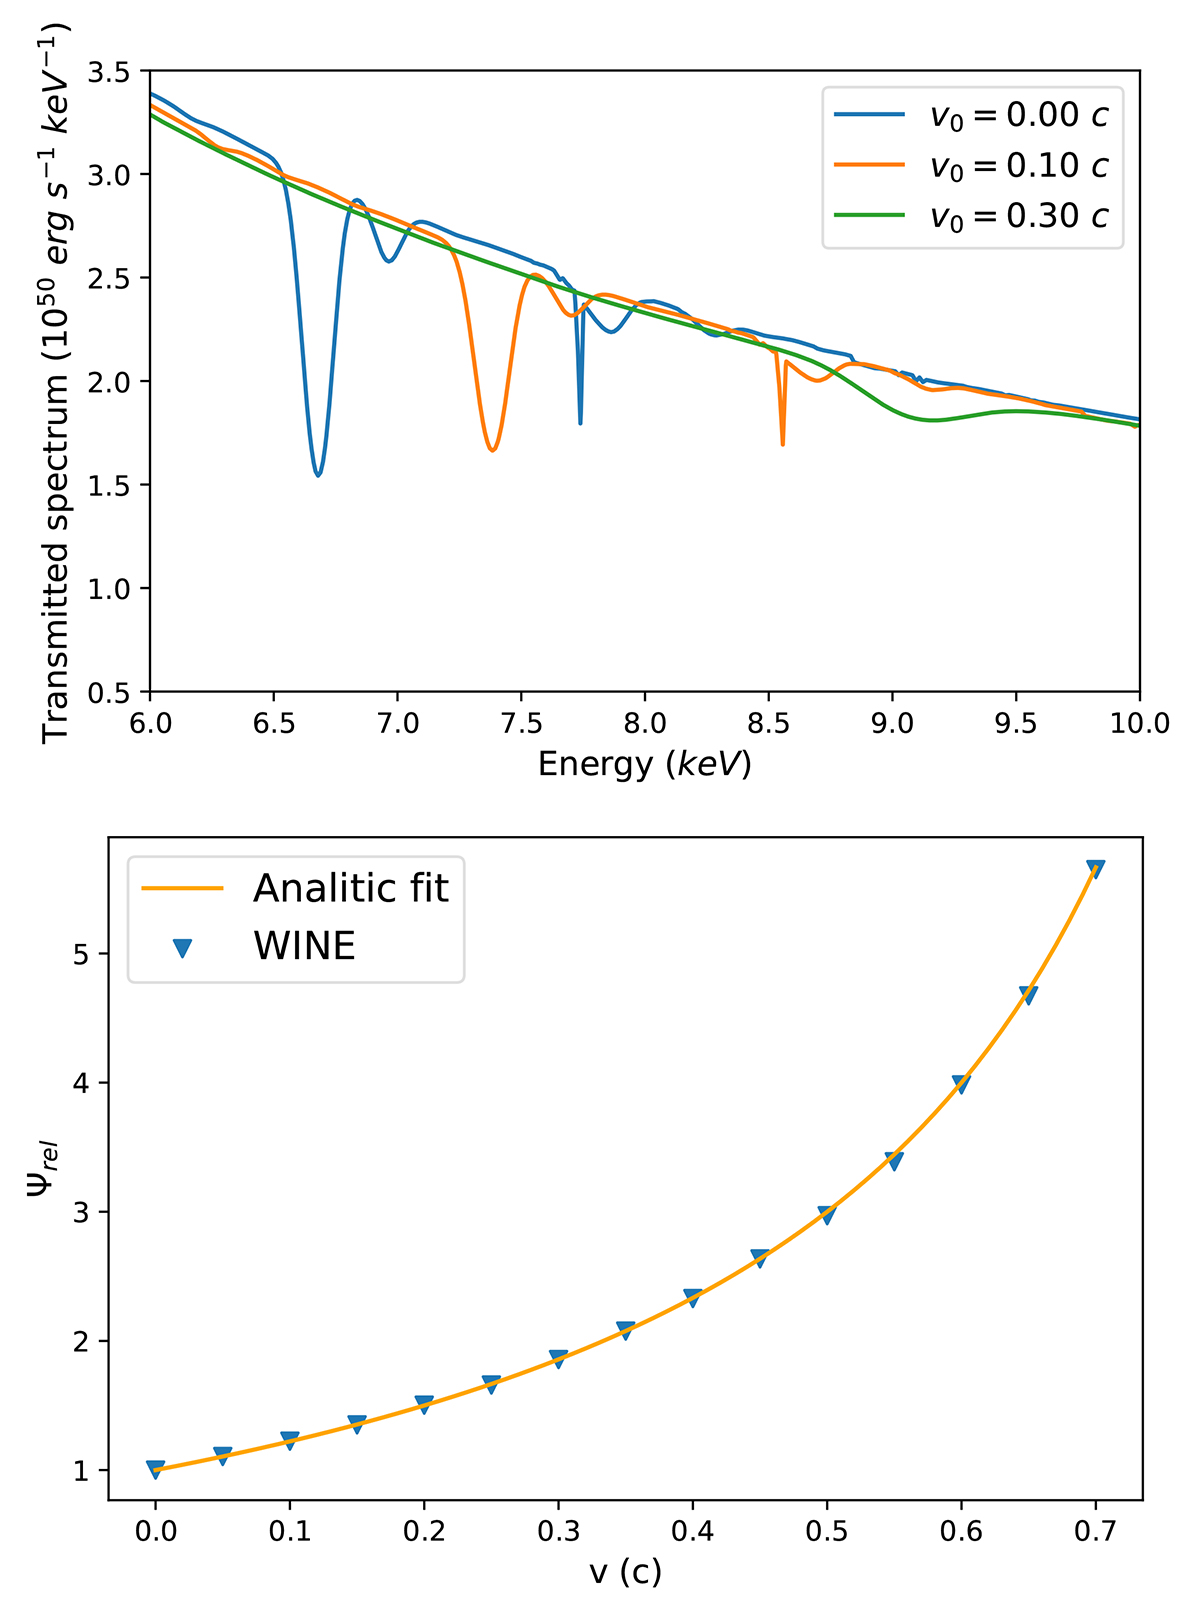
Impact of the relativistic effects on the asorption features. Top: Absorption profiles for v0 = 0.00, 0.10, 0.30c (colour coding, see legend) and NH = 1023, log(ξ0) = 4 in the rest-frame spectrum between 6–10 keV. For increasing v0, absorption lines are increasingly blueshifted and show lower EWs, as was expected from special relativity effects. Bottom: Ratio, Ψrel, between intrinsic and observed gas opacity as a function of the gas velocity, v (in units of c).
Current usage metrics show cumulative count of Article Views (full-text article views including HTML views, PDF and ePub downloads, according to the available data) and Abstracts Views on Vision4Press platform.
Data correspond to usage on the plateform after 2015. The current usage metrics is available 48-96 hours after online publication and is updated daily on week days.
Initial download of the metrics may take a while.