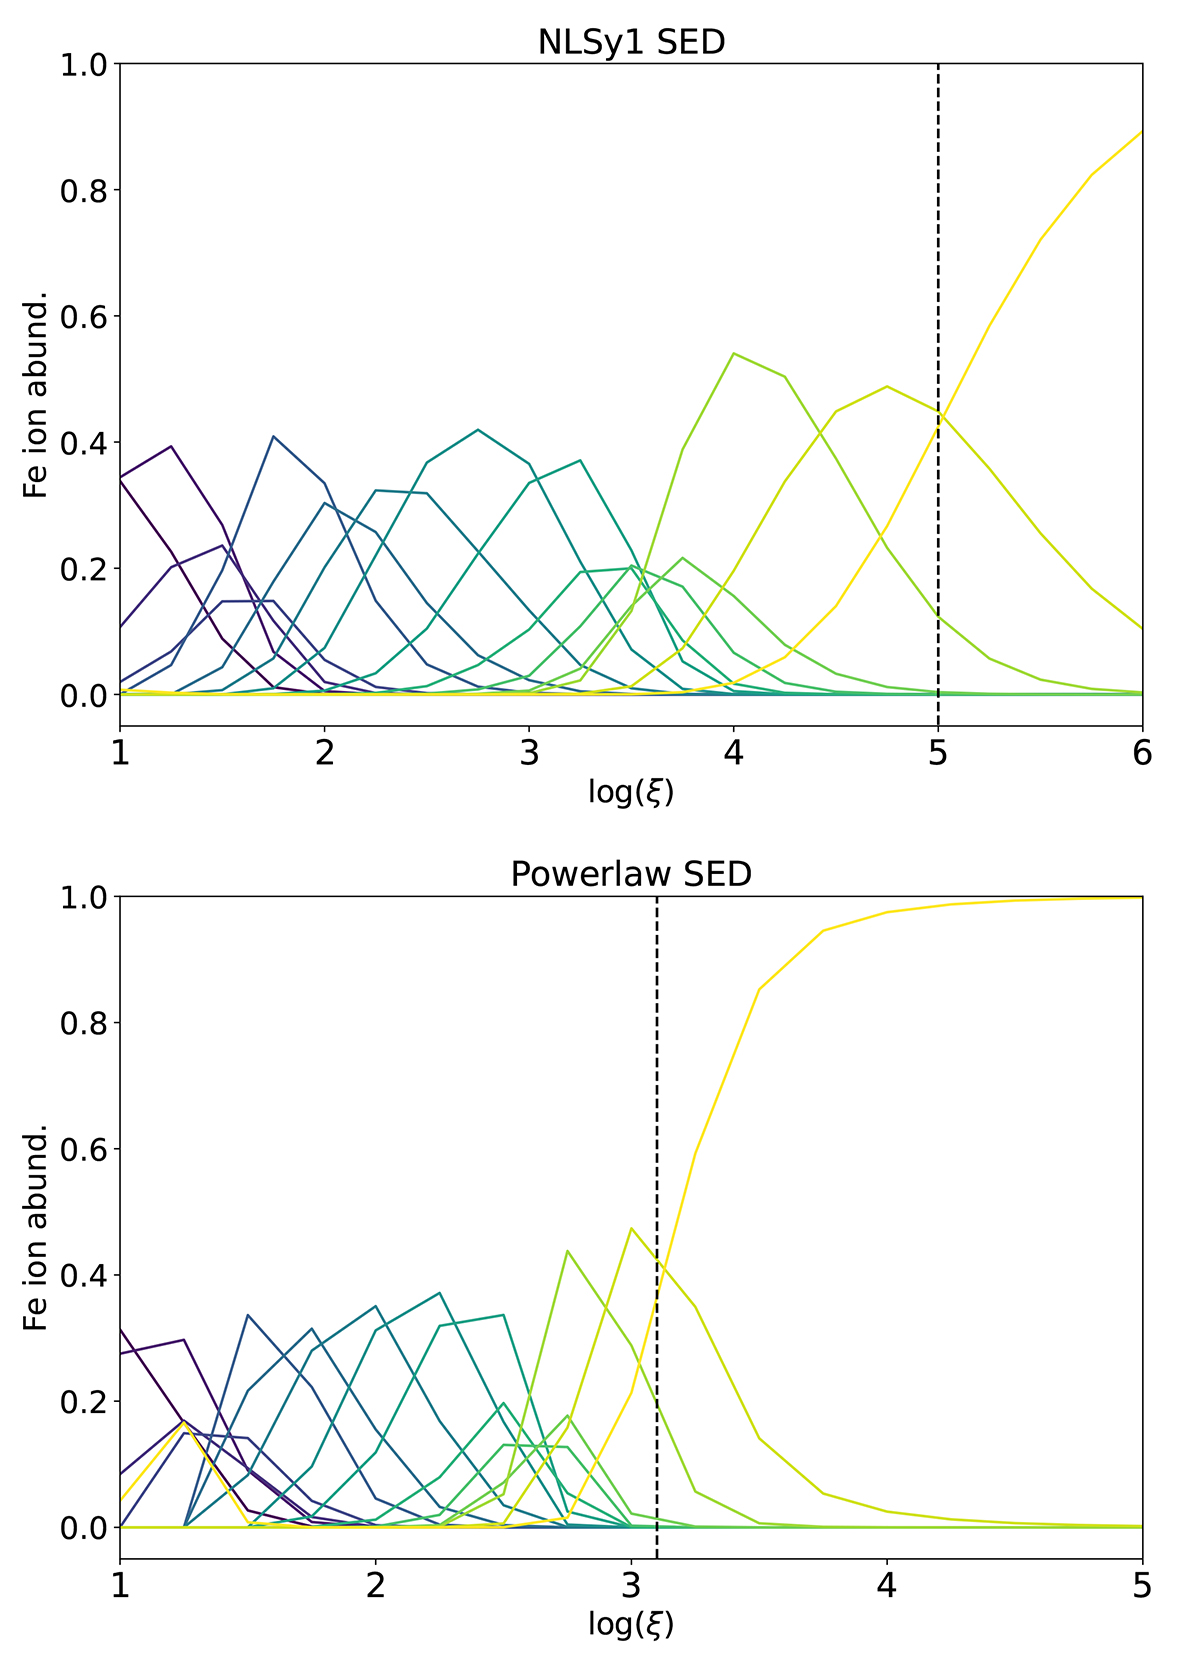
Fig. 13.
Download original image
Iron ion abundances (computed with XSTAR) as a function of log(ξ) for an optically thin slab and assuming either an NLSy1 (top) or a powerlaw (bottom) incident SED. Dark to light colours correspond to the increasing ionic charge, with the lightest (and rightmost) line being Fe XXVII. Dashed vertical lines in the top and bottom panels correspond, respectively, to the input and best-fit values (see text).
Current usage metrics show cumulative count of Article Views (full-text article views including HTML views, PDF and ePub downloads, according to the available data) and Abstracts Views on Vision4Press platform.
Data correspond to usage on the plateform after 2015. The current usage metrics is available 48-96 hours after online publication and is updated daily on week days.
Initial download of the metrics may take a while.